Stock Market Ticker
Net Change $ or %
Capital Gain or Loss
Income
Stock Market Data Charts
100
MOT 4.2K@ 8.38 v 0.16
How many shares of MOT were traded and at what price per share?
4,200 shares, $8.38
100
Current periods closing price: $1100
Previous periods closing price: $1000
Net change in percentage?
10%
100
Fran bought 3850 shares of DreamWorks stock for $26.45 per share. In April she sold the shares of stock for $27.10 per share. What was Fran's profit or loss on DreamWorks stock?
Profit $2502.50
100
You own 2,000 share of a corporation that pays quarterly dividends of $0.51 per share. What is the annual income for your stock?
$4,080
100
On what day did stock A close at a price lower than it opened? 
Tuesday
200
MOT 4.2K@ 8.38 v 0.16
What was the value of the MOT trade?
$35,196
200
Current periods closing price: $1500
Previous periods closing price: $1400
Net change in percentage? ( to the hundredths place)
7.14%
200
Francesco bought 14 shares of Disney stock for $39 per share. Two years later he sold the shares of stock for $122 per share. What was Francesco's profit or loss on Disney stock?
$1162 Profit
200
Ms. T purchased 3,725 IVV stocks. This is her quarterly dividend income when the dividend rate is $5.90.
$2494.38
200
What was the difference between the highest and lowest prices during this period?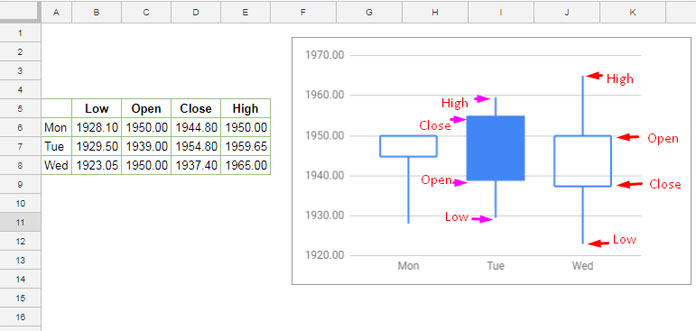
$41.95
300
C 76K @ 3.42 ^ 0.09
What was the previous day’s closing price for the stock $3.33?
300
On April 25, Berkshire Hathaway Inc closed at $126,875 per share. One year earlier, one share closed at $108,750. What was an approximate one-year percent change? (To the nearest tenth of a percent)
16.7%
300
Mr. Coyer sold his 2,300 google stocks for $2,375 pps today. He purchased it for $954 pps 5 years ago. This would be his capital gain percentage. To the nearest hundredth percent.
148.95%
300
You own 1,500 shares of a $27.45/share stock that pays $1.51 dividend quarterly.
What is the annual dividend income from this stock?
$9060
300
M T W Th
The bottom line is 40 and it goes up by 5s. What was the high price for Tuesday?
$55
400
C 76K @ 3.42 ^ 0.09
What is the total value of all of the CitiGroup shares traded?
$259,520
400
Mr. Coyer purchases stocks that had a previous pps of $679.24. Today that stock has a net change of +7.14%. This the the current pps for the stock.
$727.74 pps
400
You bought 20 shares of stock in Nike for $50 per share. Two months later you sold the 20 shares of stock for $75 per share. What was your profit or loss on Nike stock?
$500 Gain
400
Barnes and Noble had a $1.00 annual dividend during 2008. If you owned 500 shares of Barnes and Noble, how much did you receive quarterly on a dividend check?
$125
400
Identify the differences between a bear and a bull market
Bear Market is falling prices. Bull Market is when prices are going up aggressively.
500
What was the previous day's closing price?
MOT 4.2K@ 8.38 v 0.16
MOT $8.54
500
Ms. T purchased AAPL stock at $167.52 pps. The previous close for this stock was $169.45 pps. This is the percent change for that day.
-1.14%
500
Luis bought 100 shares of Amazon stock for $200 per share. Two months later, Amazon stock is worth $150 and Luis sells 10 shares. What was his profit or loss on those shares?
$500 Loss
500
The quarterly dividend for Tiffany, a jewelry company, was $0.17 during the second quarter of 2008. What was the annual dividend for 2,000 shares?
$1360
500
A type of chart that is similar to a stock bar chart. It may be easier to read and contains more information at a glance. The top and bottom of the vertical line indicate the high and low prices over the given time period. The rectangular region is known as the real body and is displayed in two different colors depending upon the action for the day on that stock
Candlestick Chart