Measures of Center
Center Continued
Measures of Spread
Box Plots
Spiral it Back!
100
What is the mode of the dotplot below?
0 hours
100
What is the mean of this data set?
3, 7, 6, 5, 10
6.2
100
Which dot plot has a larger standard deviation?
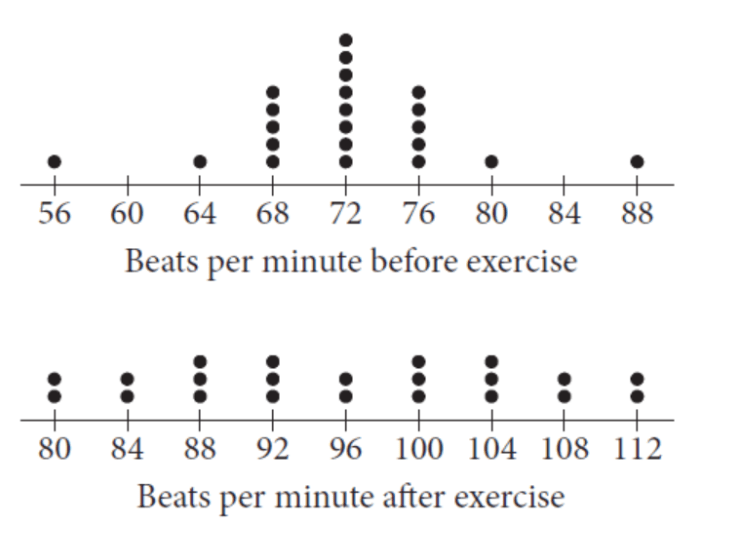
After Exercise (bottom graph)
100
What is the first quartile (Q1) of blueberry pies sold?
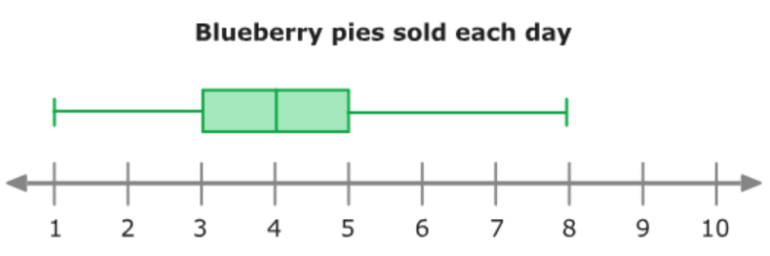
3 pies
100
How many students read 2 books?
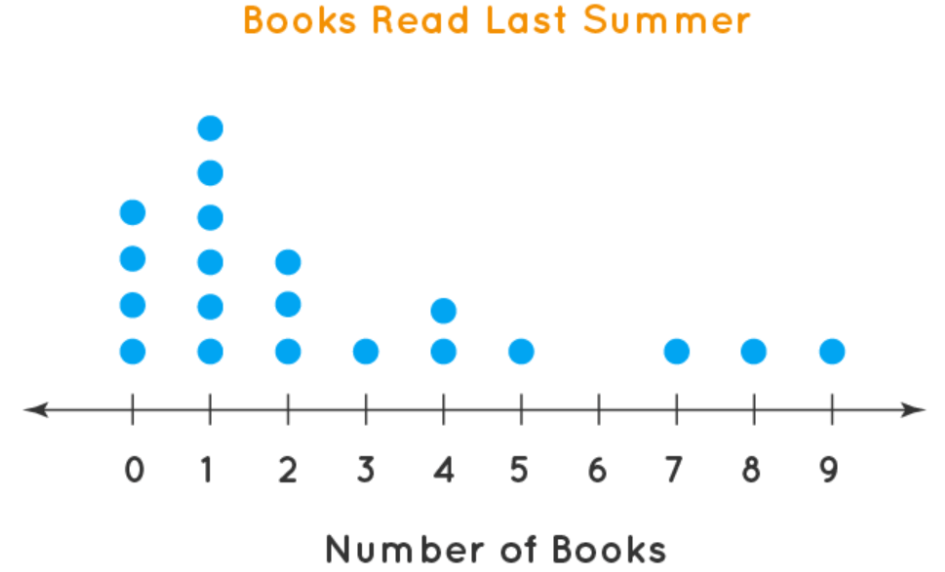
3 students
200
What is the median of this data set?
6, 8, 2, 10, 4
6
200
Find missing value using the information below.
13, 16, 17, 4, 7, x
mean = 10
x = 3
200
What is the range of the data set below?
51, 54, 56, 48, 67, 59, 61, 63, 64
67 - 48 = 19
MAKE SURE YOUR LIST IS IN ORDER!
200
What is the IQR of the data set below?

2
200
What is the shape of the dot plot below?

Skewed right
300
Calculate the median of the dotplot below.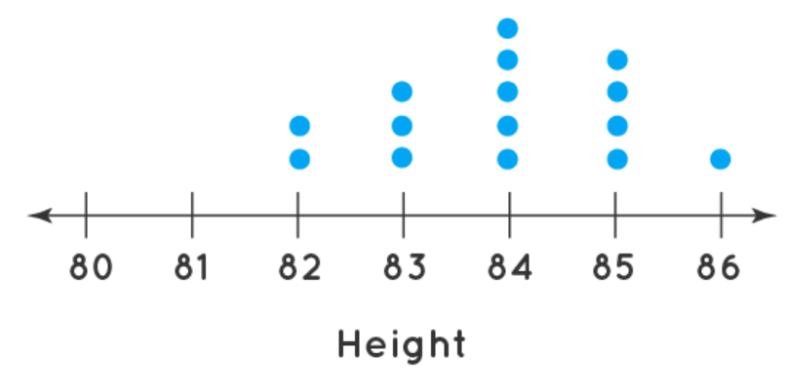
84
300
Haley wants to bring up her grade in biology. She got a 87, 79, and a 92 on the first three quizzes. What would she need on the last test to bring up her quiz average to a 90?
102 (extra credit???)
300
What is the IQR of the data set below?
5, 6, 7, 2, 1, 4, 7
7 - 2 = 5
MAKE SURE DATA IS IN ORDER
300
What percentage of the data below is greater than 16?
75%
300
Suzie worked for 37 hours this week and was paid $795.50 before taxes. How much is she paid per hour?
$21.50 per hour
400
What is the average number of cars?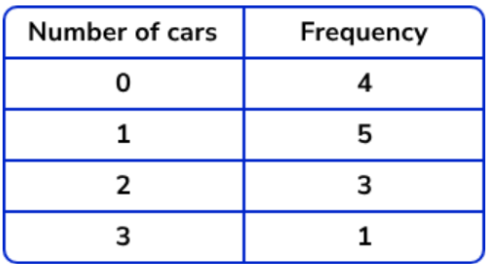
1.1 cars
400
Kyla's grade report from her English class is below. What would be her overall average in class?
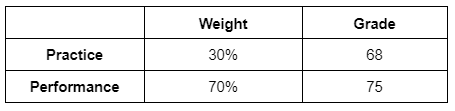
72.9 (C-)
400
A new student joined the class and reported that he read 20 books over the summer. If he is added to the dot plot below, would the standard deviation increase, decrease, or stay the same?
Increase (more spread out!)
400
The box plots below show data on time sleeping throughout the week. Which day of the week has the highest minimum?
Saturday
400
Tyler biked 3 miles in 11 minutes. How long would it take to bike 14 miles?
51.3 minutes
500
What is the median temperature?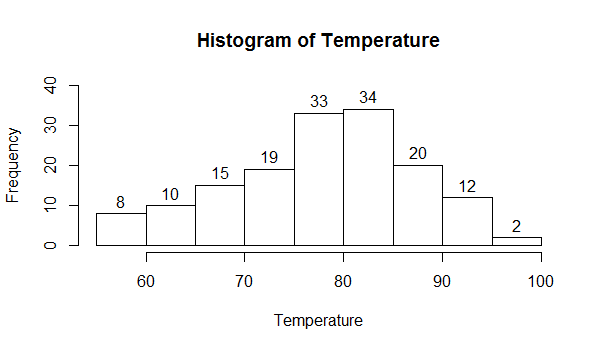
75-80 degrees
500
The average of the data values below is 10. Solve for x.
2x, 5x-1, 6, x+3
x=4
500
The frequency table below includes data on the number of pets owned by students in Mr. Johnson's class. A new student joins the class and reports that they own 10 dogs. How would the new student affect the standard deviation of the data set? Explain why!
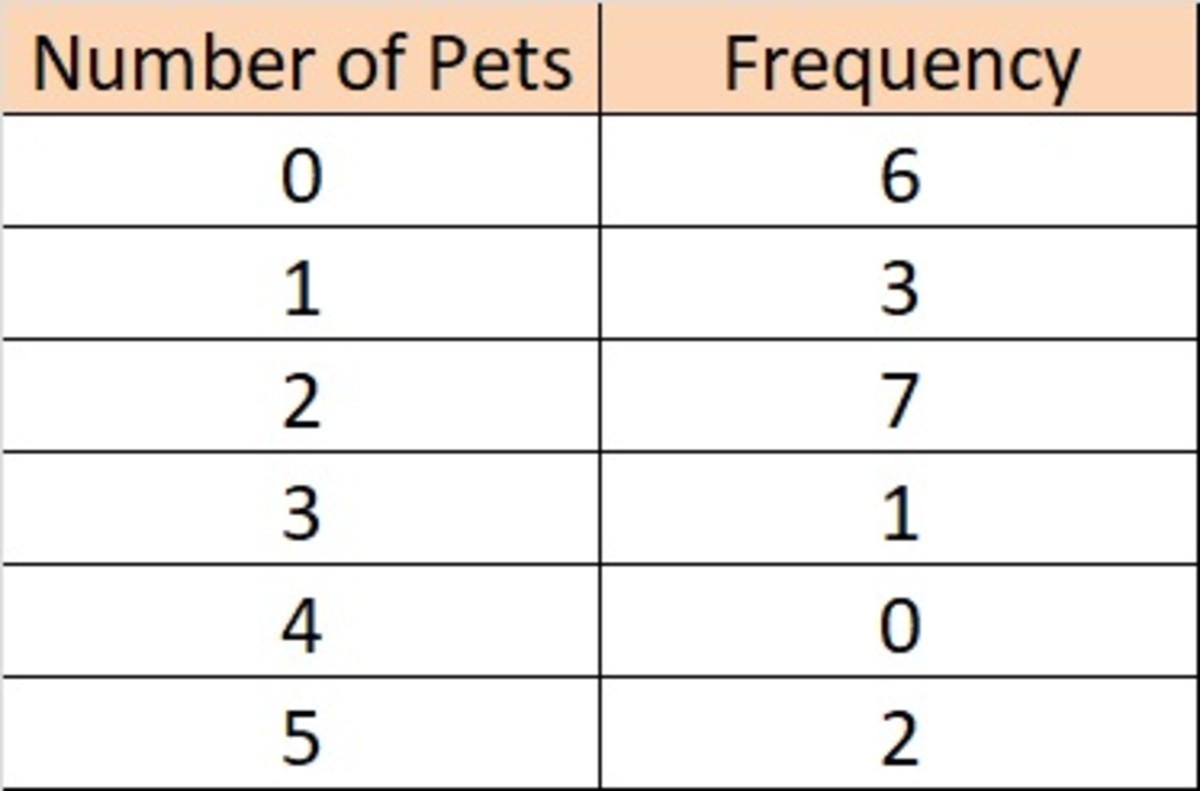
The standard deviation would increase because the data is becoming more spread out.
500
Create a data set that would result in no whisker on the left of the boxplot.
Answers will vary!
(a value will repeat enough times for the minimum and Q1 to be the same value)
500
Bob is filling up his family pool for the summer. He filled it with 500 gallons of water and started using a hose to go faster. The water is now flowing from the hose at 4 gallons per minute. How much water will be in the pool after 1.7 hours?
908 gallons