Measures of Center
Center from Displays
Measures of Spread
Definitions
Statistical Questions
100
The median of this data set?
6, 8, 2, 10, 4
What is 6?
100
What is the mode of the dotplot below?
0 hours
100
What is the range of the data set below?
51, 54, 56, 48, 67, 59, 61, 63, 64
62-19 = 43
MAKE SURE YOUR LIST IS IN ORDER!
100
The middle of the data when listed from least to greatest.
What is the median?
100
Is this a statistical question?
How old are you?
What is yes?
200
The mean of this data set?
3, 7, 6, 5, 10
What is 6.2?
200
Calculate the median of the dotplot below.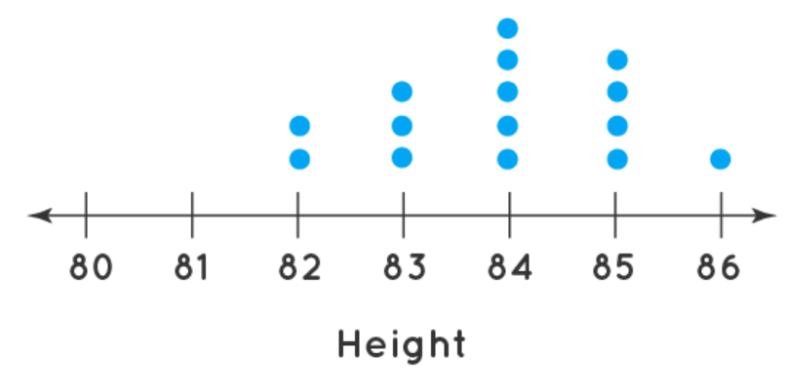
84
200
The range represented by this data.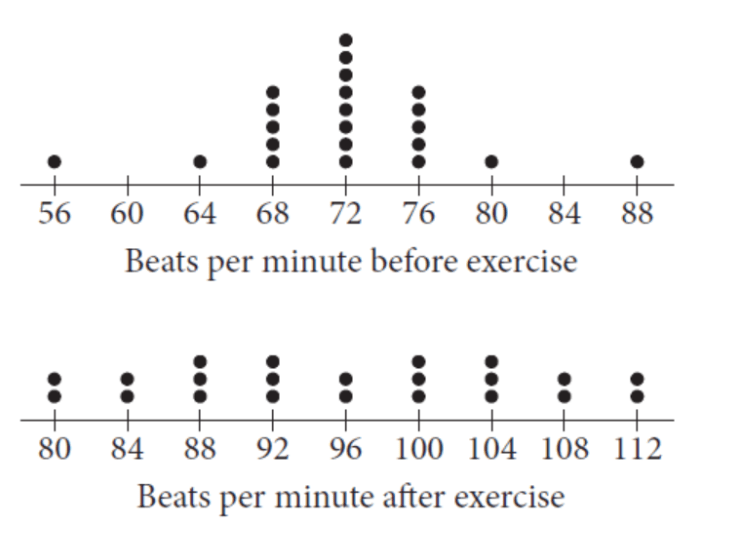
What is 32?
200
The mode of a bar graph or dot plot is called this.
What is a peak?
200
Is this a statistical question?
Do you have braces?
What is no?
300
The mode of the following data?
42, 45, 62, 35, 19, 51, 58, 51, 49, 60
What is 51?
300
What is the average number of cars?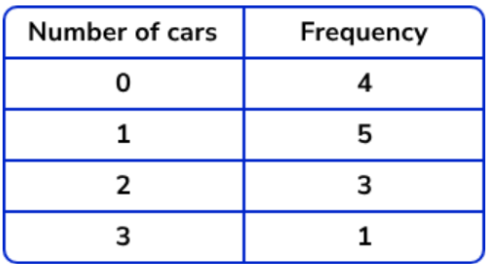
1.1 cars
300
What is the IQR of the data set below?
5, 6, 7, 2, 1, 4, 7
7 - 2 = 5
MAKE SURE DATA IS IN ORDER
300
A group of data.
What is a cluster?
300
Is this a statistical question?
Which sport do you prefer to watch, football or basketball?
What is no?
400
The mean of the following set of data.
42, 45, 62, 35, 19, 51, 58, 51, 49, 60
What is 47.2?
400
What is the median temperature?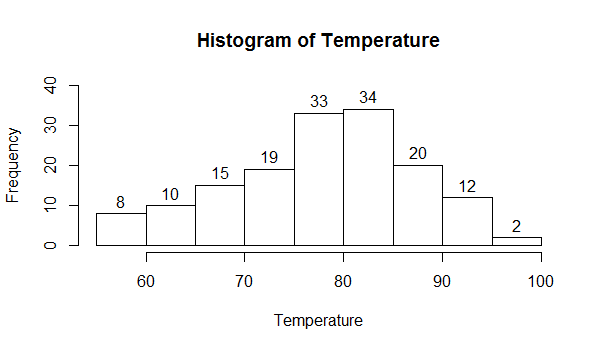
75-80 degrees
400
A new student joined the class and reported that he read 20 books over the summer. If he is added to the dot plot below, what would the median be?
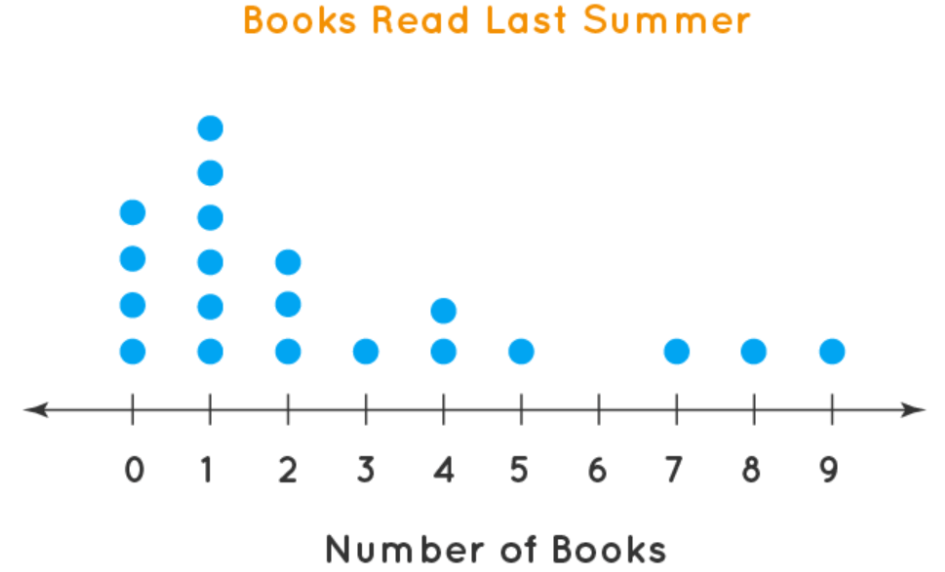
What is 2?
400
Data points that are not in the cluster of the rest of data.
What is an outlier?
400
Is this a statistical question?
How many minutes do you play your musical instrument each week?
What is yes?
500
Haley wants to bring up her grade in biology. She got a 87, 79, and a 96 on the first three quizzes. What would she need on the last test to bring up her quiz average to a 90?
98
500
Kyla's grade report from her English class is below. What would be her overall average in class?
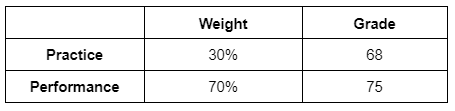
72.9 (C-)
500
The frequency table below includes data on the number of pets owned by students in Mr. Johnson's class. A new student joins the class and reports that they own 10 dogs. How would the new student affect the range of the data set? Explain why!
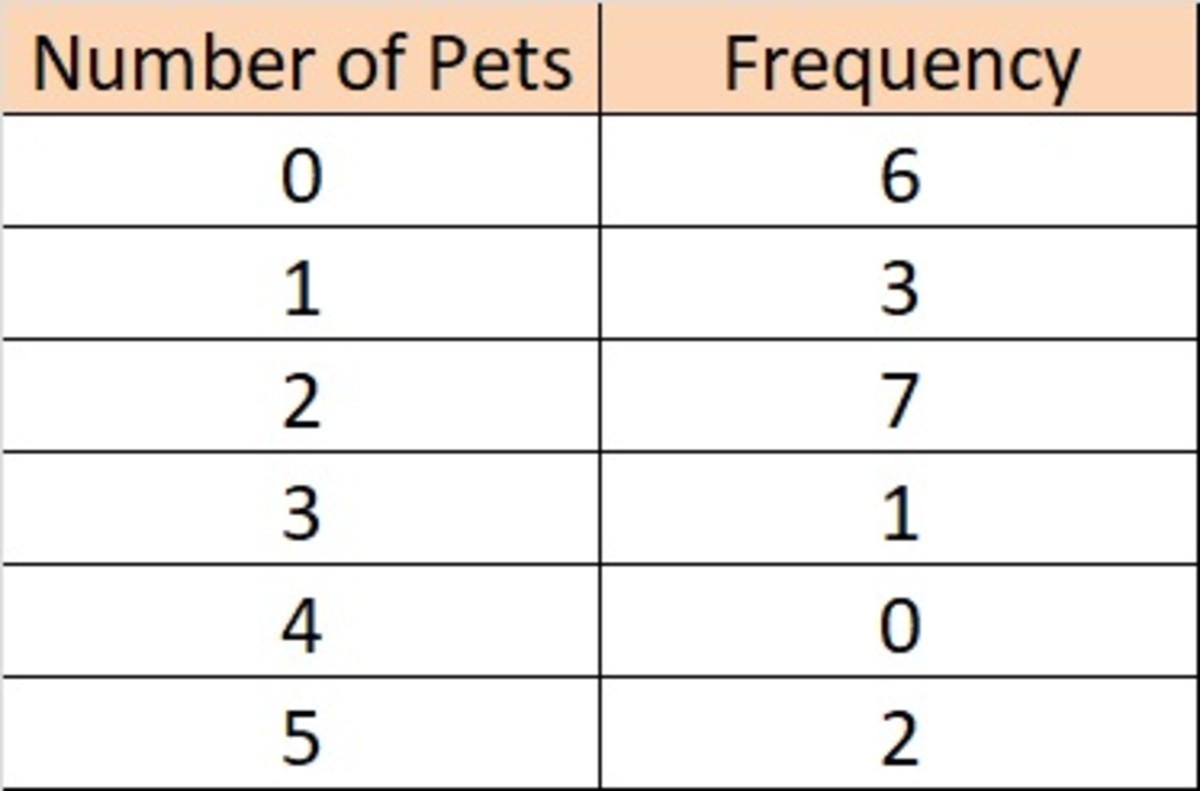
What is increase?
The range would increase because the data is becoming more spread out.
500
It is the difference between Q3 and Q1 and represents 50% of the data.
What is IQR?
500
Write a statistical question about math class.
Answers will vary.