M&M&M&R
Box & Whiskers
GRAB BAG
Graphs
100
What is the mode?
13, 18, 13, 14, 13, 16, 14, 21, 13
13
100
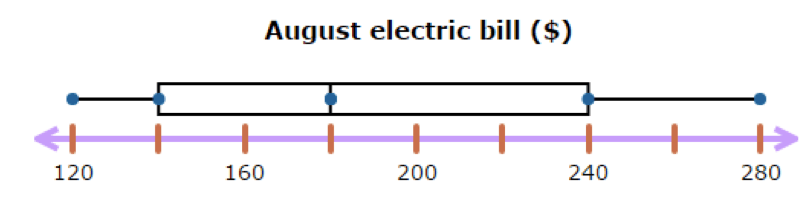
The local utility company released a report showing the August electric bills of their customers. This box-and-whisker plot shows the results.

What was the minimum value?
$120
100
Identify if the sample is biased or non-biased for the sample questions.
In the dark Jamie picked out t-shirts from her closet.
Non-Biased
100
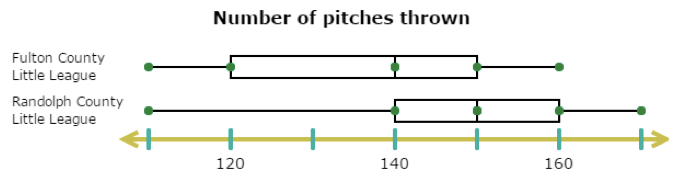
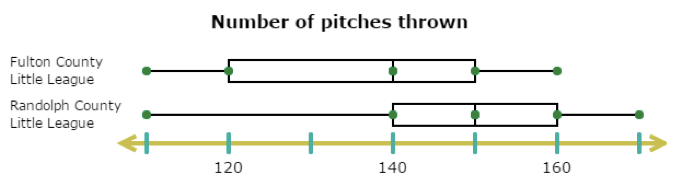
Which statement is supported by the data?
A) Randolph County has better pitchers. B) Fulton County has fewer pitchers. C) The median number of pitches thrown by Randolph pitchers is higher than that of Fulton. D) Randolph County will win more games.
C) The median number of pitches thrown by Randolph pitchers is higher than that of Fulton.
200
Bob graphed the amount of snow that fell in the last days.
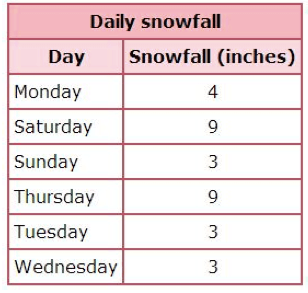
What is the mode of the numbers?
3
200
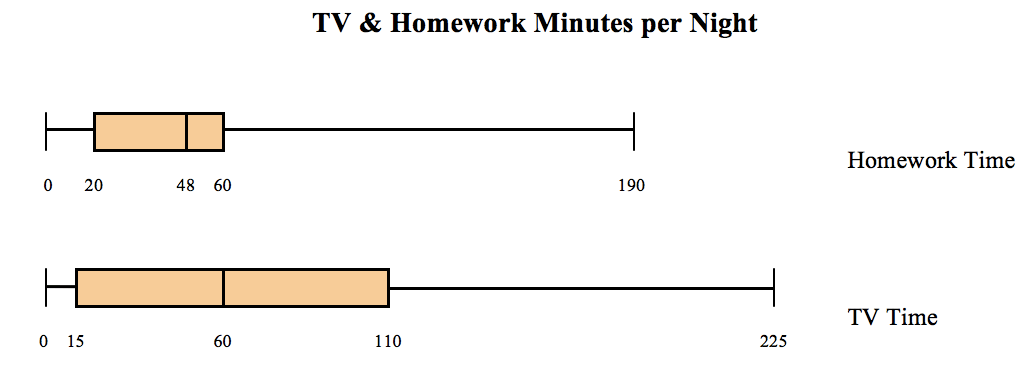
What is the 3rd quartile for the TV time data?
110 min.
200
Is the scenario a biased sample or a random sample?
Dorothy surveyed the first 20 people to use a new website.
Random Sample
200
The following data represents the hours spent practicing soccer in the past days.
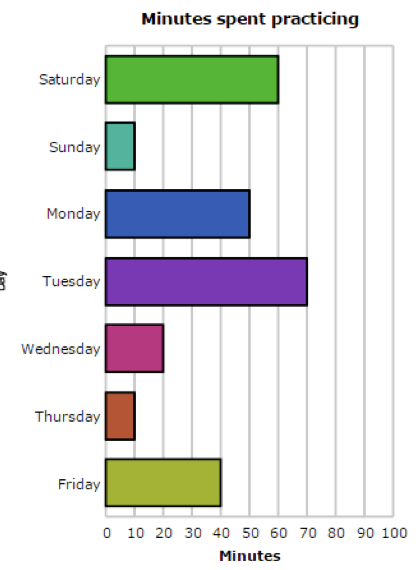
What is the median?
40 min.
300
The Jaeger family drove through midwestern states on their summer vacation. Gasoline prices varied from state to state as follows:
$1.79, $1.61, $1.96, $2.09, $1.84, $1.75
What is the range of gasoline prices?
$.48
300
What is the 1st quartile?
$140
300
The _________ is the entire group of items or individuals from which the samples under consideration are taken.
Population
300
The box plot shows the heights of grade 7 students in two random samples from two different schools. The sample item from each school is 30% of the student population.
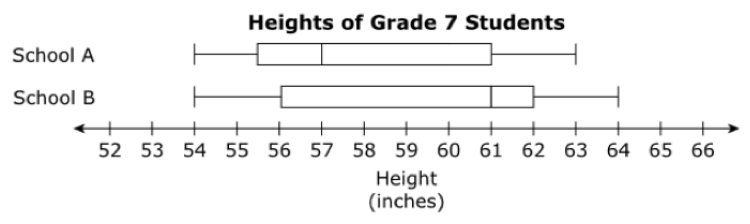
Which school do you believe to have shorter students and why?
School A are typically shorter than grade 7 students from School B because of the difference in the medians of grade 7 student heights at the schools.
400
Consider the data of rainfall (in millimeters) for the first few days of the month:
3, 4, 1, 3, 7, 6
Find the median of the given data.
3.5 mm
400

Is it more common for a sophomore at this high school to spend more than 1 hour on homework or more than 1 hour watching TV? Explain.
More on TV.
400
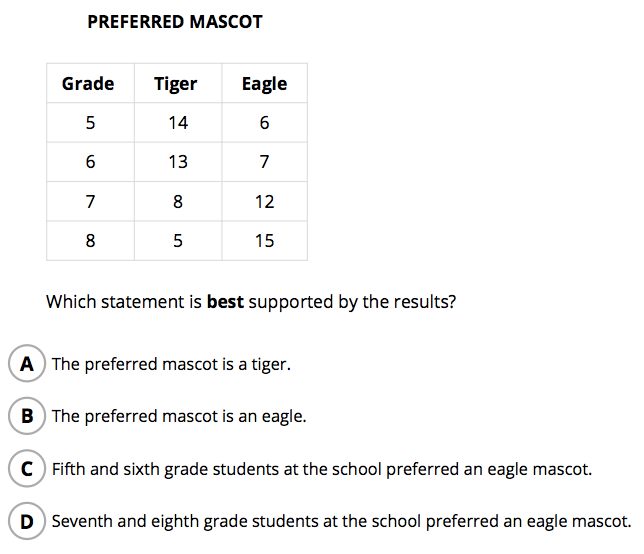
D) Seventh and eighth grade students at the school preferred an eagle mascot.
400
Which statement is supported by the data?
A) Randolph County has better pitchers. B) Fulton County has fewer pitchers. C) The median number of pitches thrown by Randolph pitchers is higher than that of Fulton. D) Randolph County will win more games.
C) The median number of pitches thrown by Randolph pitchers is higher than that of Fulton.
500
What is the mean?
13, 18, 13, 14, 13, 16, 14, 21, 13
15
500
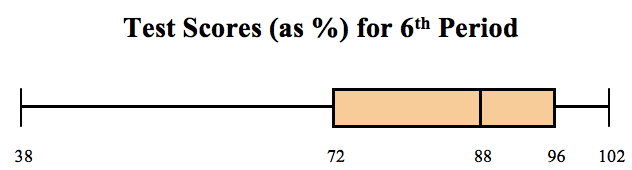
What was the median score on the test?
88
500
Hillary and Devin will collect data to find out where the seventh-grade students should take their field trip. Which group should Hillary and Devin survey to collect the best data?
A) The first students through the lunch line
B) Ten random people from each seventh-grade class C) All the students in a dance class
D) Twenty of their friends
B) Ten random people from each seventh-grade class
500
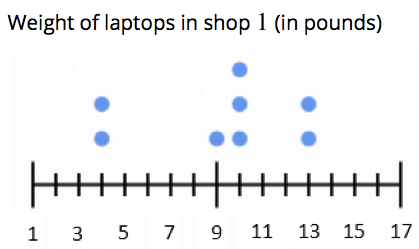
What is the median?
10