Other Terms
Sampling Methods
Mean, Median, Mode
Measures of Spread
Random
100
If you collected data on Pie preferences, what type of data have you collected?
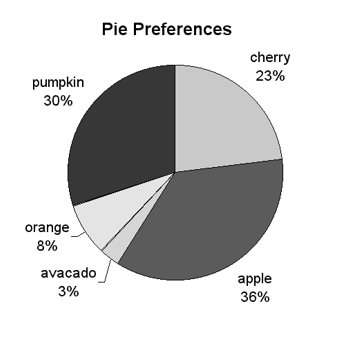
Categroical
100
You send a survey on Snapchat to your 20 most recent friends. What type of sampling method is this?
Convenience
100
Between mean, median, and mode, outliers have an effect on which one?
Mean!
100
Standard deviation is a measure of what?
Spread.
100
Explain why people volunteering to be apart of a survey would be considered bias?
Volunteers usually have strong opinions, which would give answers on the extremes.
200
Every 30th fan at an Indianapolis Colts game were randomly chosen to take part in a survey about their feelings on the stadium. What is the sample in the situation?
Every 30th fan that was chosen for the survey.
200
Every 30th fan at an Indianapolis Colts game were randomly chosen to take part in a survey about their feelings on the stadium. What is the sample method used in the situation?
Systematic
200
Find the median of the following numbers:
30, 27, 21, 29, 33, 34, 35, 19, 38, 26
29.5
200
What is the range of the data set?
A: 43, 65, 75, 78, 89, 90, 92, 95
52
200
Survey, Observational Study, or Experiment
You record information on the amount of people that order dessert at a restaurant.
Observational Study
300
Every 30th fan at an Indianapolis Colts game were randomly chosen to take part in a survey about their feelings on the stadium. What is the Population in the situation?
All fans that attended the Colts game.
300
The personnel director at a large company would like to determine whether the company cafeteria is widely used by employees. She emails every employee a survey and asks them whether they usually bring their own lunch, eat at the company cafeteria, or go out for lunch. What sampling method is used here?
Self-selected
300
Find the mean of the following numbers:
30, 27, 21, 29, 33, 34, 35, 19, 38, 26
29.2
300
Which data set would have the larger standard deviation? (Bonus for explaining why)
A: 43, 65, 75, 78, 89, 90, 92, 95
B. 64, 68, 71, 73, 76, 76, 80, 84
Set A, because the values in the data set are more spread out than set B.
300
Survey, Observational Study, Experiment or Simulation
The personnel director at a large company would like to determine whether the company cafeteria is widely used by employees. She calls each employee and asks them whether they usually bring their own lunch, eat at the company cafeteria, or go out for lunch.
Survey
400
Lebron James is signing autographs after a Lakers game. A representative of the NBA is asking the children in line who their favorite NBA player is. Explain the bias in this situation.
The children are likely to say Lebron because they are about to get his autograph.
400
Explain why conveniently picking a sample would be considered bias?
Picking people that are easily accessable (in what ever way) probably don't represent the population very well.
400
What is the Mode of the data set?
30, 27, 21, 29, 33, 34, 35, 19, 38, 26
None
400
The average score on a test was a 74 with a standard deviation of 2.5. What does this say about the test scores?
Since the S.D is low, many of the test scores are close to the average of a 74.
400
Which of the following is NOT a numerical variable?
A) The temperature of your first period classroom
B) The amount of cookies eaten yesterday in the cafeteria
C) The number of pencils in your backpacks
D) Student ID Number
E) The length of your right foot
D
500
What is the best sampling method to use?
Stratefied Sampling.
500
Simple Random Sample, Cluster, Convenience, Stratified, or Systematic.
Divide users of an online computer application into different age groups and then select a sample from each age group to ask about how much time they spend online each month.
Stratified
500
What value would need to be added to this situation to make the mean become 30?
30, 27, 21, 29, 33, 34, 35, 19, 38, 26
30
500
Find the IQR of the following data set.
30, 27, 21, 29, 33, 34, 35, 19, 38, 26
IQR = 8
Q1 = 26, Q3 = 34
500
Find the IQR for the following data
2, 3, 3, 4, 6, 7, 8, 8, 10, 13, 14
Q1 = 3 Q2 = 7 Q3 = 10
IQR = 7