It's Probably an Oddity
The Forrest through the Trees
From Trees to Stems and Leaves
The Plot Thickens
What's the Use?
100
Probability is the ratio of __________ to _________.
favorable events to total possible events
100
You flip three coins. What is the probability that all three coins show heads or all three coins show tails?
1/4 or 25%
100
Name the two important things you should not forget to put on your stem-and-leaf plot (don't say stem and leaves)
Title and key
100
What are the three columns in a frequency table?
Interval, Tally, Frequency
100
What are the two types of data we discussed?
categorical and numberical
200
On a game spinner numbered one through twenty, what is the probability of landing on a number less than 6?
1/4 or 25%
200
You are taking a test with True/False questions. If there are four questions on the test, draw a tree diagram to show the possible outcomes for how you could answer the test questions.
According to your tree, how many ways could you answer the test questions?
16
200
Can a stem-and-leaf plot have a stem with multiple digits?
Can it have a leaf with multiple digits?
Yes
No
200
Describe how to use a frequency table to make a histogram.
The intervals go along the bottom of the histogram, making sure not sure to leave gaps, and the frequency goes along the vertical axis.
200
Name five types of data displays
Any of these five: line graph, bar graph, scatter plot, circle graph, stem-and-leaf plot histogram, box-and-whisker plot
300
On a game spinner numbered one through twenty, what are the odds that you land on a multiple of 3?
3/10 or 30%
300
If there are five true/false questions on a test and you have no idea what the answers are to the questions, what is the probability that you will guess all the answers correctly?
1/32
300
Does every stem have to have a leaf? Explain why or why not.
No, because you could have a list of numbers with a large gap, but you would still list the stems. For example: 12, 15, 32, 45, 57 would have an empty stem for the twenty's.
300
What are the five values you must find for a box-and-whisker plot, and how do you find each of them?
Arrange the values in order from least to greatest. The lower extreme is the smallest value and the upper extreme is the highest value. The median is the middle number (or the average of the two middle numbers if there is an even number of numbers). The lower quartile is the median of the lower half of the data and the upper quartile is the median of the upper half of the data.
300
Describe two of the three types of misleading data displays we discussed in class.
broken vertical axis (makes differences appear larger), large increments (makes differences appear smaller), different widths (suggests comparison of area, not length)
400
You are playing a game with your friend. The game has two dice. To win the game on your next turn, you must roll a sum of at least four. What are the odds against you winning the game?
1:3
400
You flip a coin, roll a die, flip a coin, and roll a die. Use the counting principle to determine how many possible outcomes there are for this sequence of events.
144
400
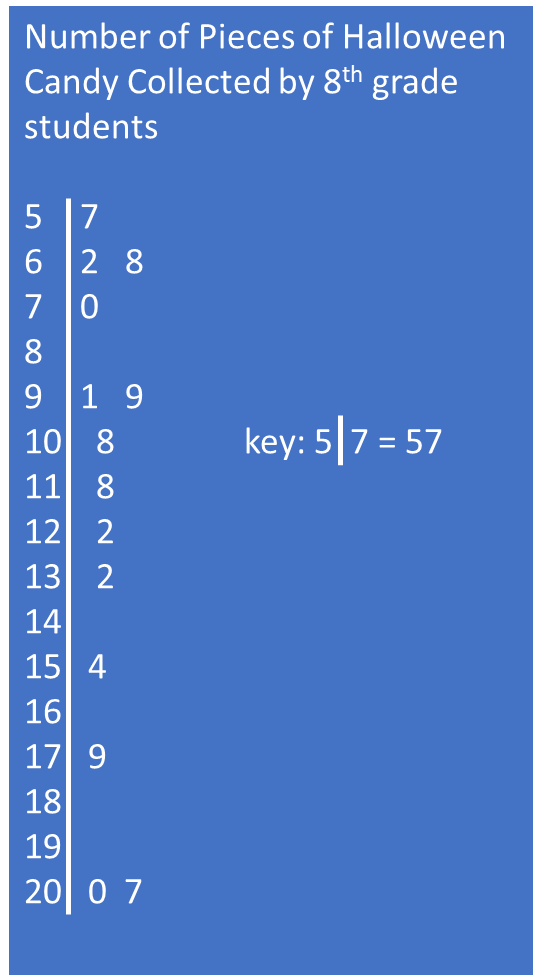
Draw a stem and leaf plot for the number of pieces of candy collected this Halloween by the 8th grade class:
154, 207, 62, 57, 99, 132, 108, 91, 68, 70, 122, 118, 200, 179
400
Find the range and interquartile range of the following set of numbers, which are the number of Christmas cookies baked by Mrs. Painter for the last 10 Christmases.
24, 3, 12, 18, 36, 54, 108, 42, 18, 40
range: 105
interquartile range: 24
400
What should go at the top of every data display that you create?
a title