Tables
Graphs
Frequency
Other Graphs
Miscellaneous
100
How do you find the width of a large data set?
Width = Range/ class
100
What values belong on the X- axis for a histogram?
Class boundries
100
Cumulative Relative Frequency adds up to
1.00 or 100%
100
What graph is organized by highest to lowest?
Pareto graph
100
During a retake the highest % you can score is a
80%
200
You will always round up this value when creating your groups.
Class width
200
This type of graph displays the cumulative Frequency
Ogive
200
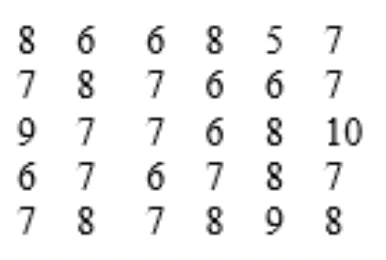 The following is data, what is the frequency of the value 6?
7
200
What type of frequency is used when creating a pie chart?
Relative Frequency
200
What is the x-axis of a frequency polygon?
Midpoints
300
The following are class limits
44-67
What are the class boundries?
LB = 43.5
UB = 67.5
300
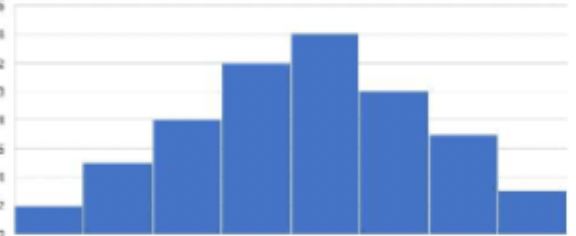
The following is what type of distribution shape?
Bell Shaped
300
Calculate the relative frequency of the following:
Frequency: 17
Total: 45
.38 or 38%
300
The following graph is used when comparing two or more groups
Compounded bar graph
300
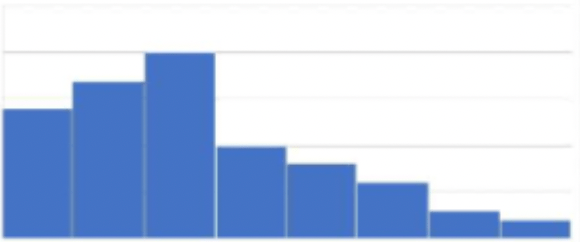
The distribution is.....
right skewed
400
What is the midpoint of the following class limits
32 - 45
38.5
400
The bars in a histogram must be..... (2 things)
1. width must be the same size
2. No gaps in between values
400
The following are frequencies of a table:
1, 4, 5, 7, 8, 9
When creating a cumulative frequency column, what would be your last value?
34
400
Represents data that occurs over a specific period of time
Time series graph
400
HW is worth what percentage of your grade?
25%
500
The following are class limits:
34.5 - 39.6
What is the class width?
5.2
500
When plotting an Ogive graph, this graphs always starts off at what value?
0
500
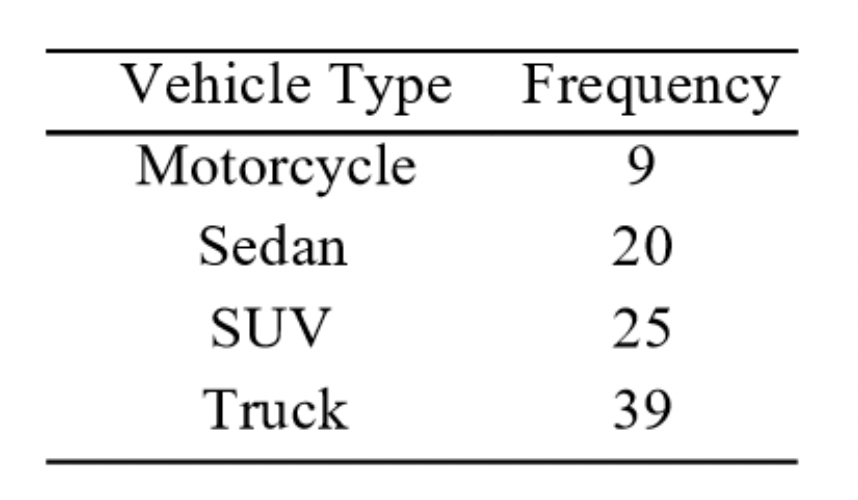 What is the relative frequency of Trucks. Rounded to the nearest whole number.
42
500
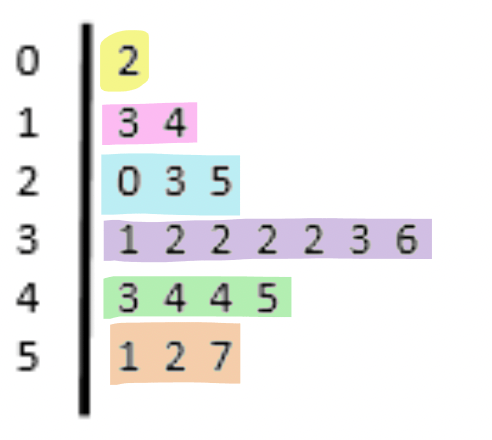 The following is an example of
stem and leaf plot
500
Who are the 3 stats teachers on campus?
Ms. Franco
Ms. Ulloa
Mr. De La Torre