6.1
6.2
6.3
6.4
6.5/6.6
100
What is a survey?
A survey is when you ask different people the same questions and record their answers.
100
What is the mode?
The mode is the number that occurs most often. (repeats the most)
100
What is a line plot?
A line plot is a graph that shows the frequency of data along a number line.
100
What is a stem-and-leaf plot?
A stem-and-leaf plot shows groups of data arranged by place value.
100
What is the scale of a graph?
The scale of a graph is a series of numbers placed at fixed, or equal, distances.
200
What is frequency?
Frequency is the number of times a response occurs.
200
What is the median?
The median represents the middle number in a set of data.
200
What is range?
The range is the difference between the greatest and the least values in a set of data.
200
Look at the following stem-and-leaf plot: 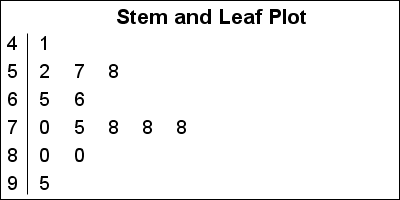
Which digits are stems?
The stems are 4, 5, 6, 7, 8, and 9.
200
What is an interval?
An interval of a graph is the difference between two number on a scale. (how much they go up by)
300
What is cumulative frequency?
Cumulative frequency is a running total of the frequencies.
300
What is the mean?
The mean is the average of a set of numbers, and is found by dividing the sum of a set of numbers by the number of addends.
300
What is an outlier?
An outlier is a value separated from the rest of the data.
300
Look at the following stem-and-leaf plot:
What is the mode?
The mode is 78.
300
Look at the graph below:
What is the scale and interval of the graph?
The scale is 0-90 and the interval is 10.
400
.gif)
How many toy cars were sold in the first three months of the year?
75 toy cars.
400
Find the mean of the following set of numbers:
3, 5, 5, 6, 3, 2
The mean is 4.
400
The following line plot shows how many times students reported playing video games in a week: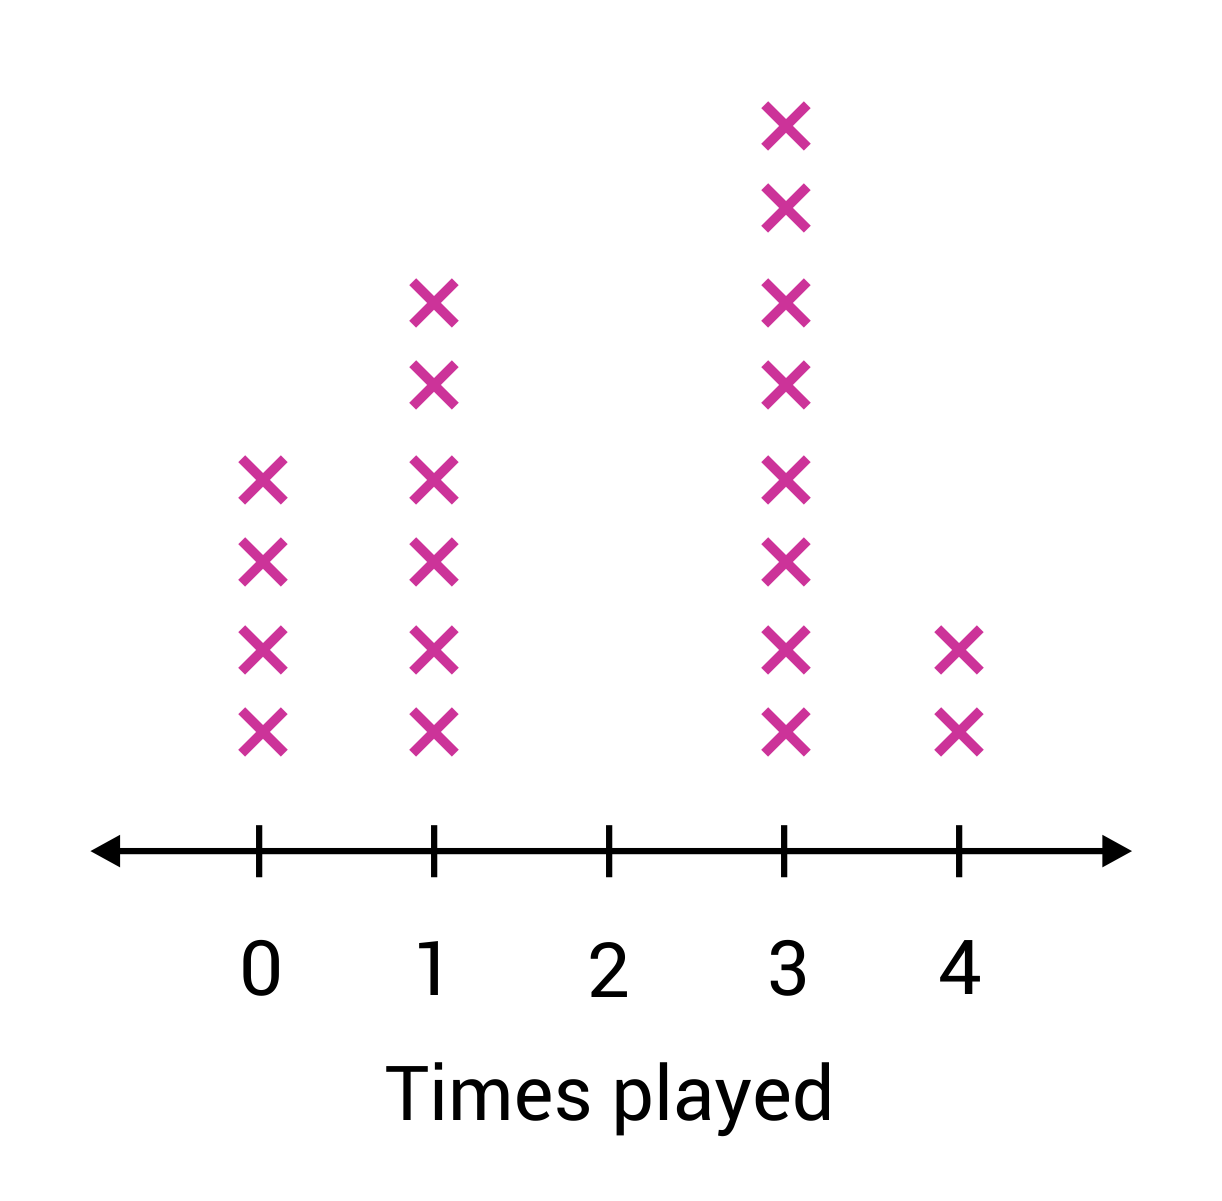
What is the range of the data?
The range is 4.
400
Look at the following stem-and-leaf plot:
What are the least and greatest values represented in the stem-and-leaf plot?
The smallest value is 41 and the largest value is 95.
400
Look at the graph below:
How would the lengths of the bars change if the interval was 2 instead?
The bars would be much longer.
500
How many toy cars were sold in all?
160 toy cars.
500
Find the median AND mode for the following set of numbers:
31, 17, 18, 15, 19, 23, 31
The median is 19 and the mode is 31.
500
The following line plot shows how many times students reported playing video games in a week:How many students played video games three times a week?
8 students
500
Look at the following stem-and-leaf plot:
What is the range?
The range is 54.
500
Look at the graph below:
How would the lengths of the bars change if the interval was 20 instead?