Key Terms
Calculate
Key Concepts
Outliers/Quartiles
100
Statistics is the study of _______
Data
100
Calculate the range of this data set
1,5,1,5,6,7,8,3,2,0
Range = 8
100
When a distribution is symmetrical, the mean is _________ the median
Equal to
100
What is our formula for outliers?
(Q1 - 1.5IQR, Q3 + 1.5IQR)
200
What makes up the 5 number summary?
min, Q1, med, Q3, max
200
Calculate the median of this data set
1,5,1,5,6,7,8,3,2,0
median = 4
200
In a skewed right distribution, the mean is ________ the median
greater than
200
The five number summary for a set of data is
1, 2, 3, 5, 9
What percent of data falls between 2 and 9?
About 75%
300
Define standard deviation
Average distance of each observation from the mean
300
Calculate the Q1, Q3, and IQR of this data set
1,5,1,5,6,7,8,3,2,0
Q1 = 1
Q3 = 6
IQR = 5
300
Calculate the IQR and Range of the data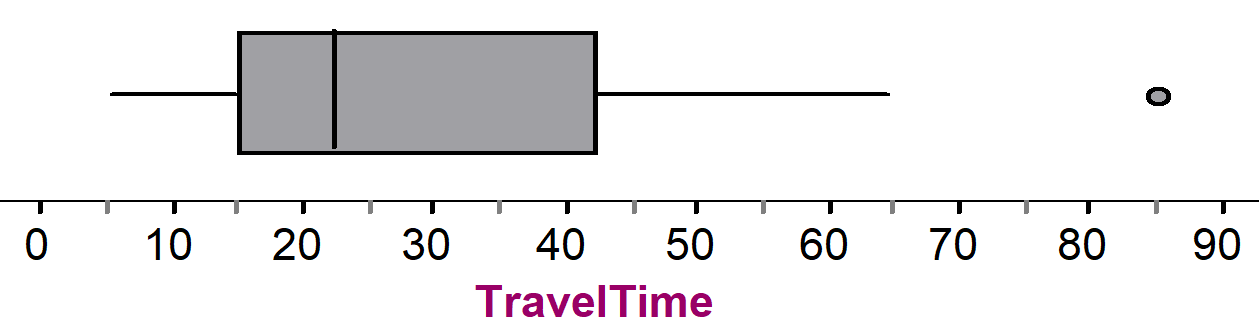
IQR = 27/28
Range = 80
300
The five number summary for a set of data with n = 24 is
1, 2, 3, 5, 9
How many people answered between 1 and 2?
About 6
400
What graphical displays describe quantitative data?
Dot plot, stemplot, histogram, boxplot
400
Find the missing value given the mean...
mean = 4.5
1, 1, 3.5, 4, 4.5, 4, 5, 6, 6.5, 6.5, 7, 8, x
x = 1.5
400
If there are 60 data points on this graph, what is the median?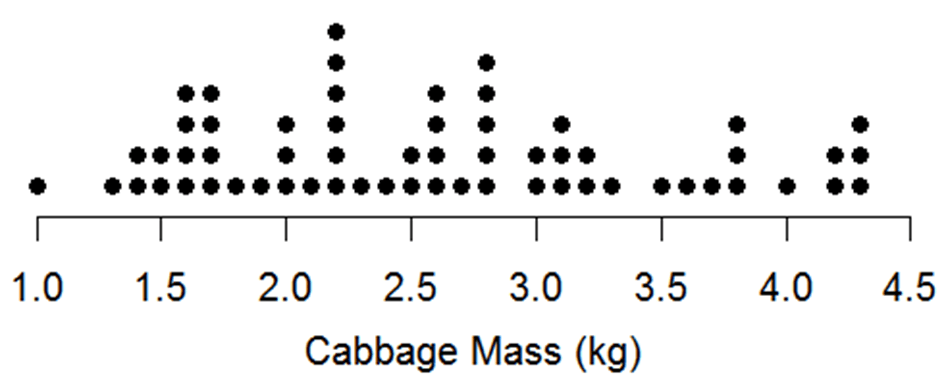
Median = 2.55
400
The five number summary for a set of data is
1, 2, 3, 5, 9
Are there any outliers?
No
500
When asked to describe a distribution, what key things do you need to talk about?
Shape, center, spread, and outliers!
500
We found the average age of 10 people...
The mean is 20
The median of the same data set is 24
If the oldest person lied and was really 5 years older, what is the new mean and median?
Mean = 20.5
Median = 24
500
Describe the shape, center, and spread of the # of goals scored in 34 games by the US women's national team.
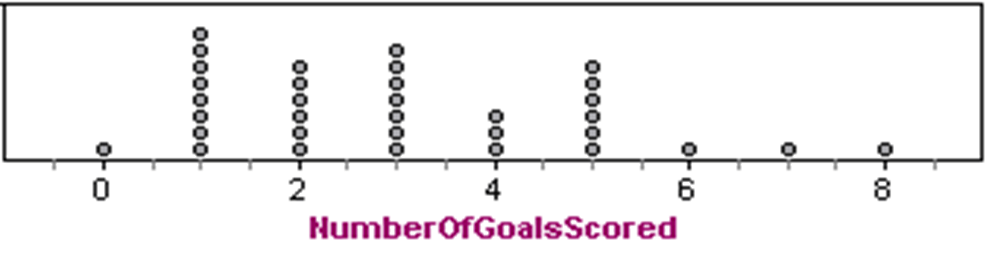
Skewed right
Median = 3
Range = 8
500
Given the 5 number summary, what is the interval for possible outliers? (calculate the min and max)
4, 9, 10, 13, 20
(3, 19)