mu
What is population mean?
Anything that can vary, anything that can take on a different quality or quantity.
What is a variable?
Describes the center of a skewed distribution
What is median?
The mean for this list of data: 3,4,3,5,6,9
What is 5
From this normal curve, the mean of this data is
What is 510?
How can we visually tell that the mean and median are similar
What is a symmetrical/normal distribution?
Sample mean
bar x
("x-bar")
An arrangement of values of a variable showing their observed or theoretical frequency of occurrence.
What is a distribution.

How so cute?
The shape of the distribution with the following data look like? 1,2,5,5,5,6,16,16,16,17,17,17,17,17,18,18,18,18,18,18,19,19,19,19,19,19,19
What is skewed left.
This pie chart represents the radio listeners favorite football team. Out of 400 listeners that called in, this amount voted for the Bears?
What is 96 listeners voted for the Bears as their football team?
Who even are these people?
The median is to the right of the mean
What is skewed left?
S_x or S
What is the sample standard deviation?
A variable that takes numerical values for which arithmetic operations such as adding and averaging can take place.
What is Quantitative Variable.
Describes the distribution of data
What is shape, outlier, center, variability (spread)?
The shape of the distribution with the following data 1,1,1,1,1,1,1,2,2,2,2,2,2,3,3,3,3,3,4,4,4,4,5,5,5,26,29.
What is right skewed.
The standard deviation for the list 3, 4, 3, 5, 6, and 9 rounded to the nearest tenth.
What is 2.3.
There are this many FRQ questions on the AP Statistics Exam.
What is 6.
Out of 700 people, the amount of females who like to play laser tag based on the following relative frequency table
What is 105 females like to play laser tag?
Sigma
(Looking for two responses)
What is sum?
What is the Greek letter
Sigma?
Minimum, Q1, M, Q3, and Maximum
What is Five-Number Summary
(1+2+3+4+5)/5
for the data set
What is the mean?
The shape of a distribution with the following data 1,1,1,1,2,2,2,3,3,3,4,4,4,4.
What is Uniform.
The IQR for the distribution of quiz grades in this list:
80 95 74 90 85 95 80 75
What is 15?
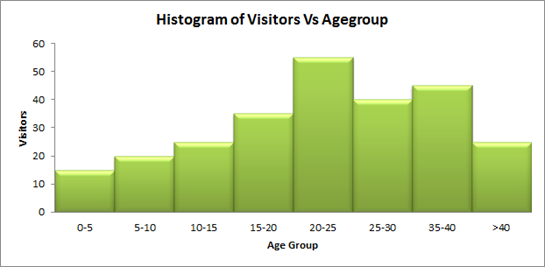
The shape of the distribution.
What is the data of visitor age is skewed left?
The percentage of females who prefer SUVs
What is 75% of females prefer SUVs?
Q_1
What is the middle data point between the minimum and the median?
A listing of data or information
What is a data distribution?
The outlier(s) of
1, 11, 23, 9, 12, 25, 14, 2, 13, 15
What is 25?
The percent of students who watched more than 15 minutes of TV is
What is 75% watch more than 15 minutes of TV?
The mean is to the right of the median
Sample size
What is
n?
A portion of the population
What is sample?
The standard deviation of the following distribution:
80 80 80 80 80
What is 0?
The proportion of people who like dance parties who are male
The College Board AP Statistics Exam will be administered on this date.
What is May 8, 2025.