Measures of Central Tendancy
Measures of Variance
Box and Whisker Plots
Histograms
Hodge Podge
100
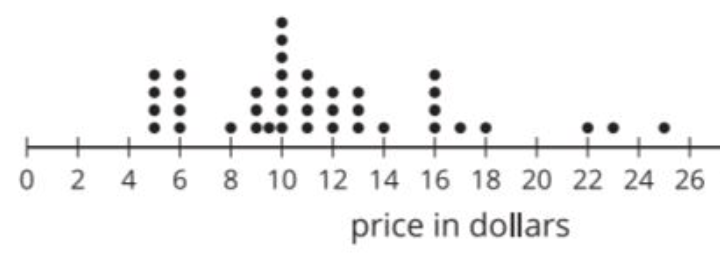
Determine the median of the set of data:
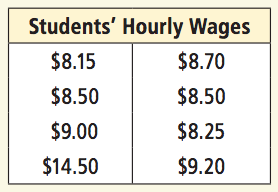
$8.60
100
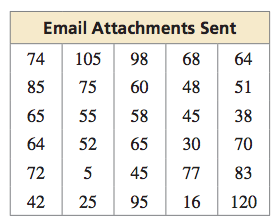
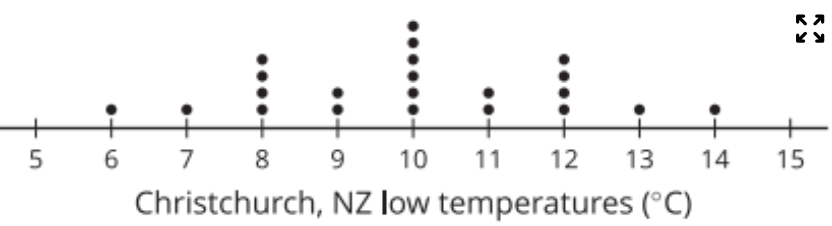
30 employees shared how many attachments they received in emails last week. Determine the RANGE (maximum - minimum) of the ENTIRE set of data.
115
100
Determine the five number summary of the data represented in the box and whisker plot.
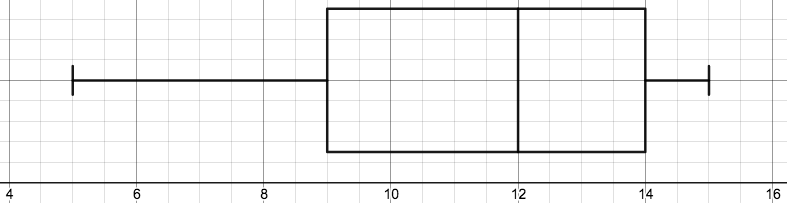
{5, 9, 12, 14, 15}
100
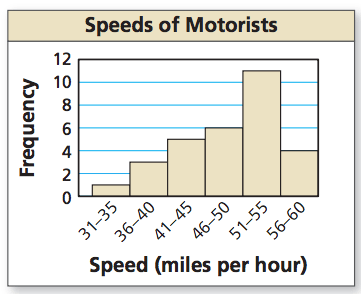
Describe the shape of the distribution of data shown in the histogram.
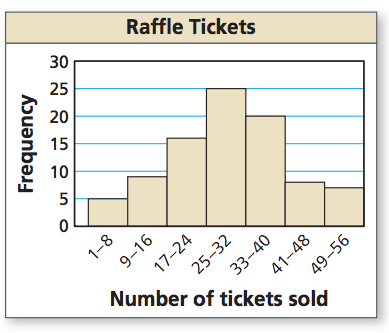
The data is bell shaped and symmetrical.
100
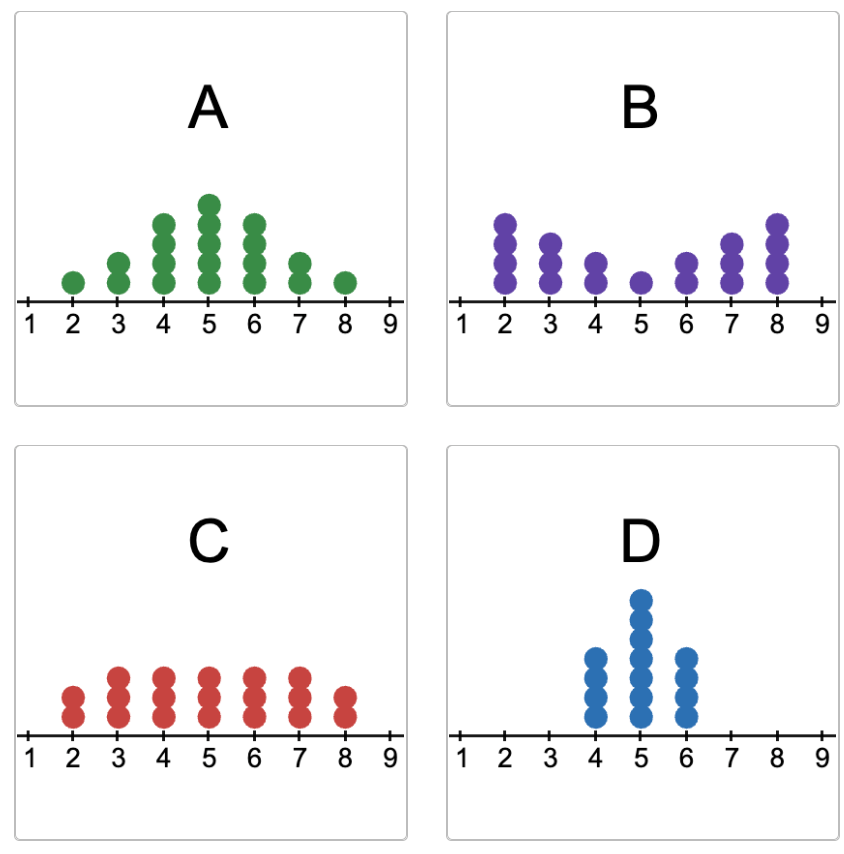 Which dot plot shows data with the lowest standard deviation?
D
200
Determine the mean of the following set of data.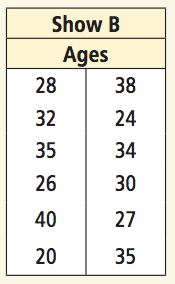
30.75
200
Determine the interquartile range for the set of data shown in the box and whisker plot.
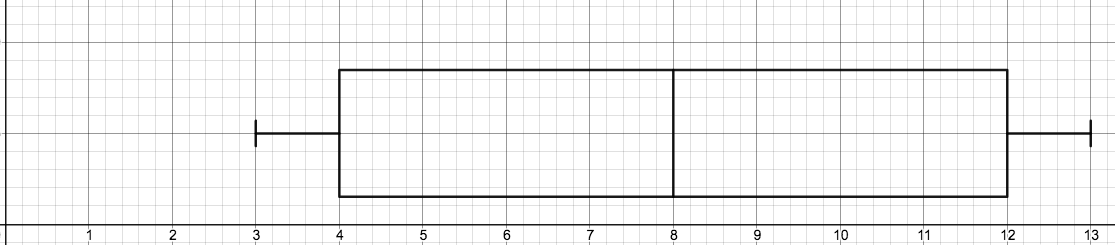
8
200
Determine the five number summary of the set of values:
30, 27, 32, 25, 12, 22, 20, 29, 35
{12, 21, 27, 31, 35}
200
How many people are represented in this histogram?
30 people
200
Which is the best estimate the standard deviation of the data:
A. 2 B. 4 C. 6 D. 9
A
300
If the data value of 10 was changed to 100 in the following set of data,
a. By how much would the mean change?
b. By how much would the median change?
3, 3, 3, 4, 4, 5, 5, 7, 7, 7, 8, 8, 9, 9, 10
a. Mean would change by 6 (6.13 to 12.13)
b. Median would stay at 7
300
Determine the five-number summary for the set of data.
24, 30, 30, 22, 25, 22, 18, 25, 28, 30, 25, 27
{18, 23, 25, 29, 30}
300
Create a box and whisker plot for the set of values:
−18, 0, 7, −8, −12, 15, 21, 0, 1, −3
{-18, -8, 0, 7, 21}

300
Which bin in the histogram contains the median?
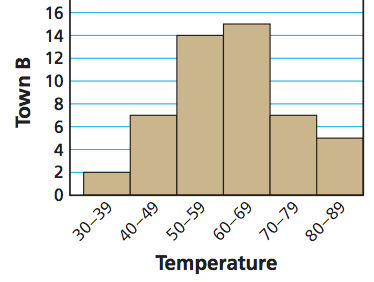
60-69
300
Is the mean of the data higher or lower than the median? Explain why?
Because the data is slighly skewed right, the mean will be slightly higher than the median.
400
Which measure of central tendency is the best representation of the data in the histogram, and why?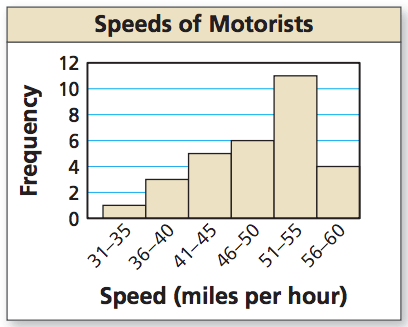
Median. Because the data is skewed left, with a larger amount of larger values, the median would be the best measure of center.
400
Clearly describe the variability of Ms. Neil's period 3 class's percentages.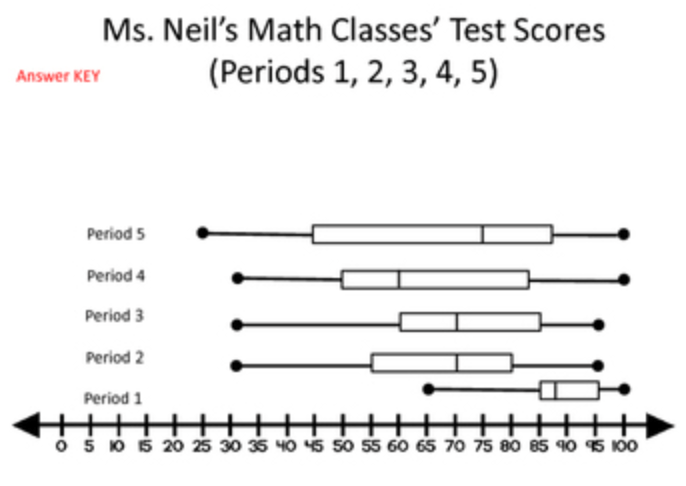
The middle half of the students' scores varied by 25%
400
Create a box and whisker plot of the following set of data:
104, 75, 125, 90, 104, 320, 170, 134
{75, 93.5, 114.5, 161, 320}

400
These are the following wait times at a restaurant. Create a histogram with 5 bins, the first being 0-9. 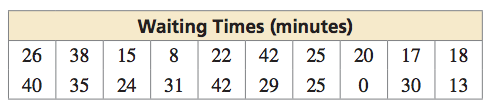
Check for equal width in bins, correct bin labels, frequency axis marked correctly.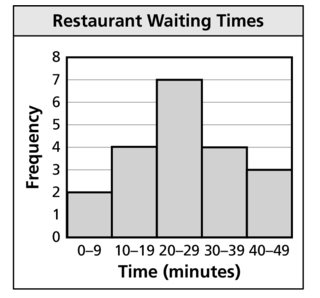
400
Which forest has a larger standard deviation?
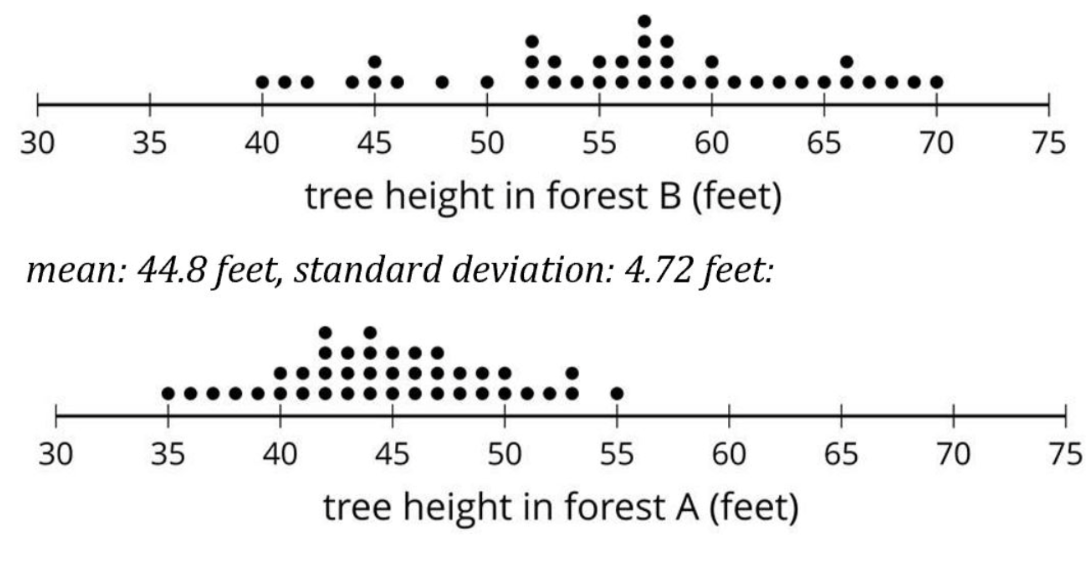
A
500
Determine a set of 10 values that has a mean which is twice its median.
Answers may vary. Ex:
10, 10, 10 ,10, 10, 10, 10, 20, 50, 60
500
Which histogram has a larger standard of deviation? How can you tell?
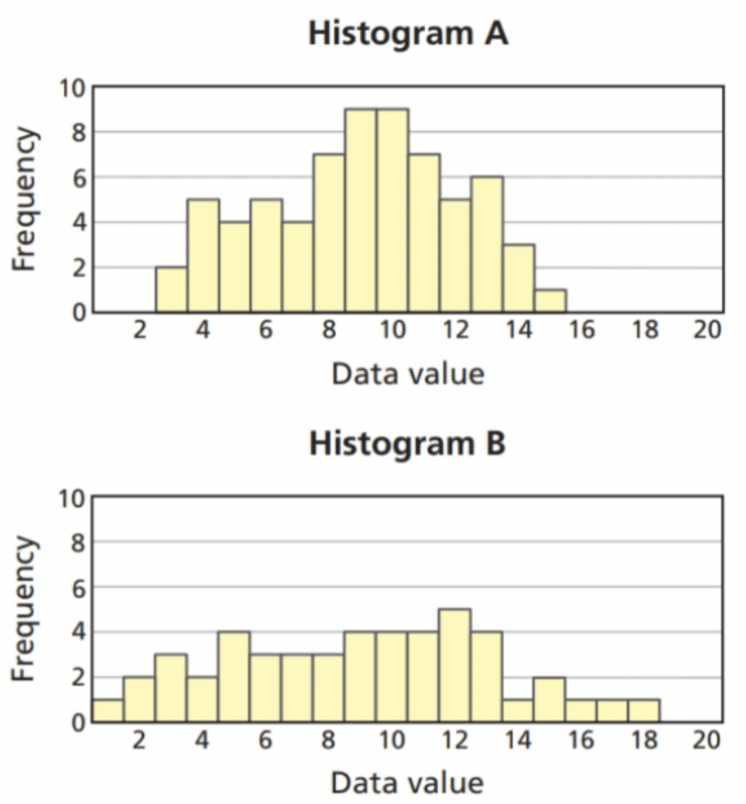
A. There are more data values away from the mean (around center of the data, as both displays are symmetrical).
500
Create a box and whisker plot given the data in the stem and leaf plot below.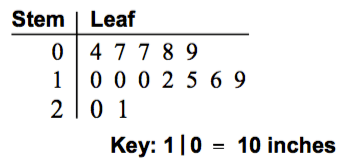
{4, 8, 10, 16, 21}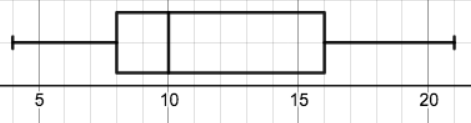
500
The table shows the last gas purchases at the pump.
Display the data in a histogram using six intervals, starting with 10 and going by 15's.
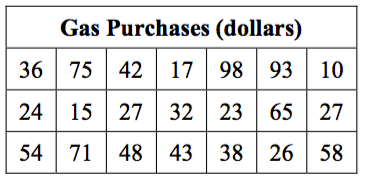
Check for equal bin intervals, correct bin heights, and frequency axis correctly set up.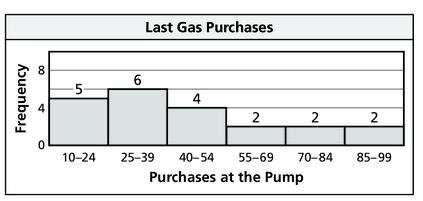
500
Interpret the mean and standard deviation in the context of the data.
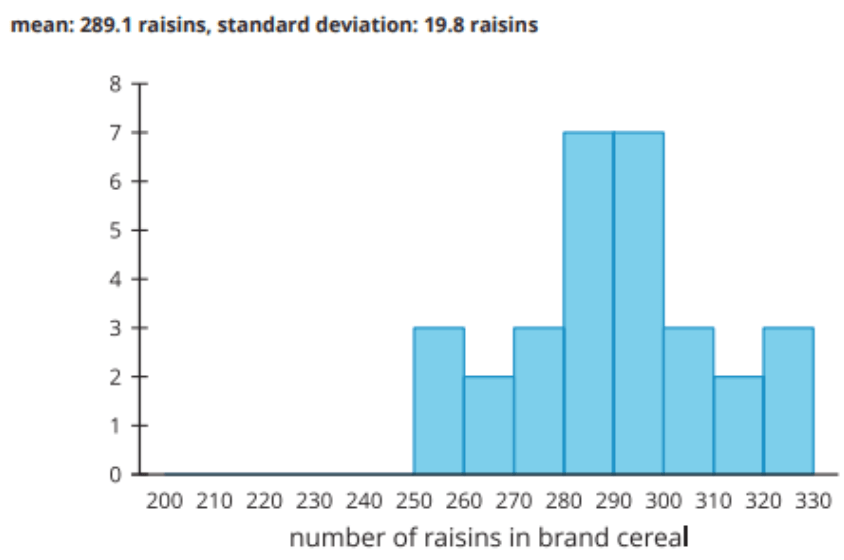
There are typically 290 raisins in a box of cereal, with a variance of about 20 raisins, more or less, in each box.