Vocabulary
Graphs
Name That Graph
Measurement
Miscellaneous
100
What is a tally?
A mark made to keep track and display data recorded from a survey.
100
 How many people chose orange as the nicest fruit?
30 people.
100
 What kind of graph is this?
Tally Chart
100
What is a half inch?
One of two equal parts of one inch.
100
How do we take a survey?
Ask people the same questions.
200
What is a quarter inch?
One of four equal parts of one inch.
200
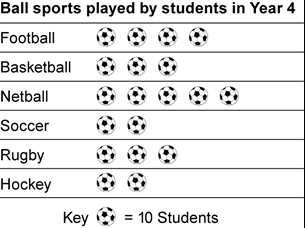 How many students played Football?
40 students
200
 What kind of graph is this?
Line plot
200
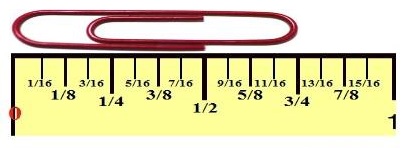
3/4 inches
200
What part of a graph tells us how many each symbol represents?
The key.
300
What is the definition of scale?
A set of numbers that represents the data in a graph
300
 Using this information, make a line plot on number 1 on your worksheet.
300
What kind of graph is this?
Frequency table
300
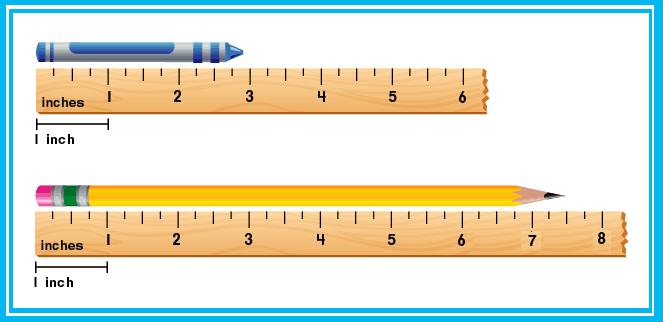 How many inches is the pencil?
7 1/2 inches (or 7.5 inches)
300
True or False: Studying and reading the data of a graph is to interpret.
False. It is to analyze.
400
What is interpret?
To explain what a graph shows.
400
 Create a bar graph using this information on number 2 on your worksheet.
400
.gif) What kind of graph is this?
What kind of graph is this?
Pictograph
400
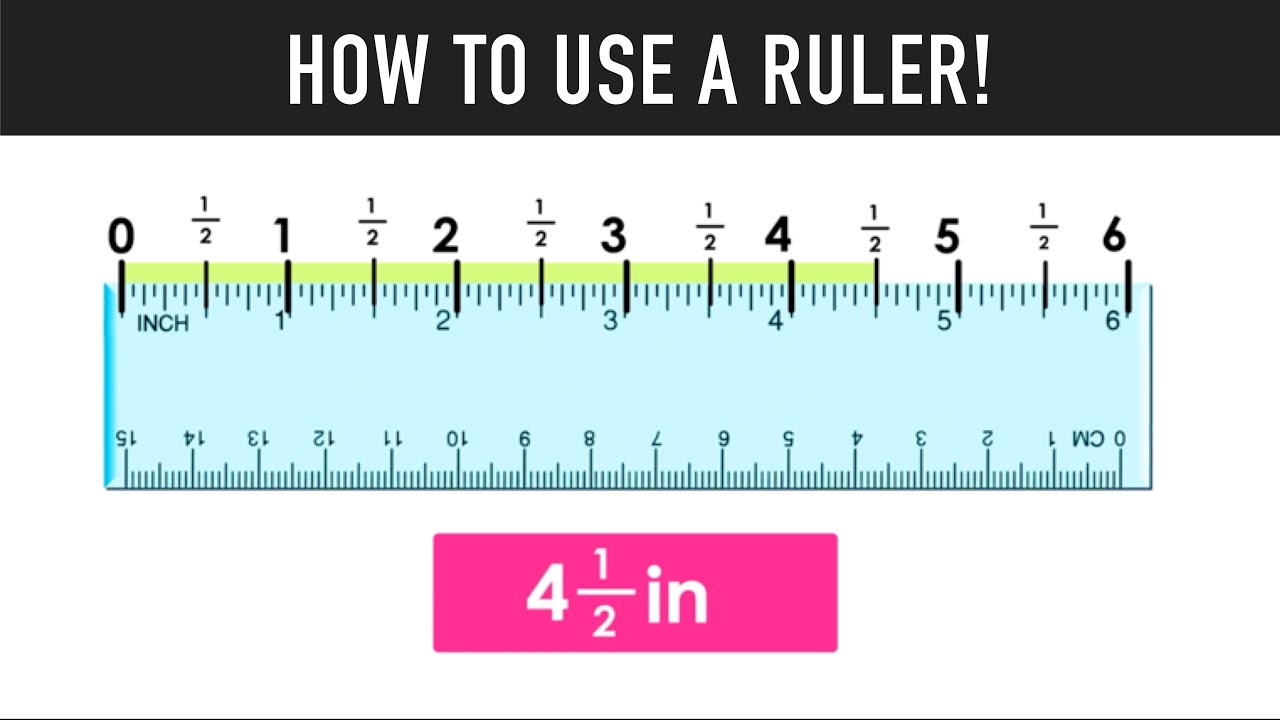 How many inches is the line?
4 1/2 inches (or 4.5 inches)
400
How are a pictograph and picture graph different?
A pictograph uses the same symbol to represent more than one tally. A picture graph uses different pictures to represent each tally.
500
What is data?
Collected information or facts.
500
 Using this information, create a picture graph with a key on number 3 on your worksheet.
500
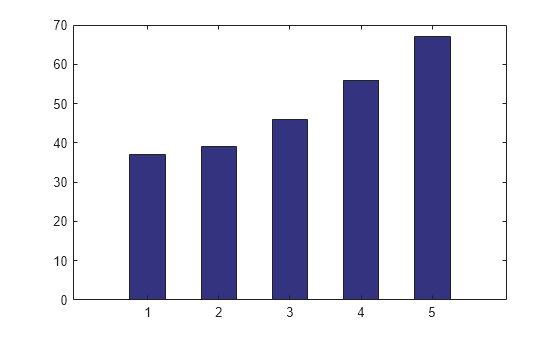 What kind of graph is this?
Bar Graph
500
 What do the 3, unmarked lines on this ruler mean?
1/4 inch, 1/2 inch, 3/4 inch.
500
Which is bigger, 1/2 or 3/4?
3/4 (1/2<3/4)