What is a tally?
A mark made to keep track and display data recorded from a survey.

30 people.
 What kind of graph is this?
Tally Chart
What is a half inch?
One of two equal parts of one inch.
How do we take a survey?
Ask people the same questions.
What is a quarter inch?
One of four equal parts of one inch.
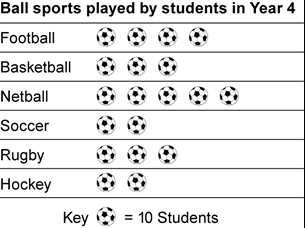
 How many students played Football?
40 students
 What kind of graph is this?
Line plot

3/4 inches
What part of a graph tells us how many each symbol represents?
The key.
What is the definition of scale?
A set of numbers that represents the data in a graph
 Using this information, make a line plot on number 1 on your worksheet.
 What kind of graph is this?
Frequency table
 How many inches is the pencil?
7 1/2 inches (or 7.5 inches)
True or False: Studying and reading the data of a graph is to interpret.
False. It is to analyze.
What is interpret?
To explain what a graph shows.
 Create a bar graph using this information on number 2 on your worksheet.
.gif) What kind of graph is this?
What kind of graph is this?
Pictograph
 How many inches is the line?
4 1/2 inches (or 4.5 inches)
How are a pictograph and picture graph different?
A pictograph uses the same symbol to represent more than one tally. A picture graph uses different pictures to represent each tally.
What is data?
Collected information or facts.

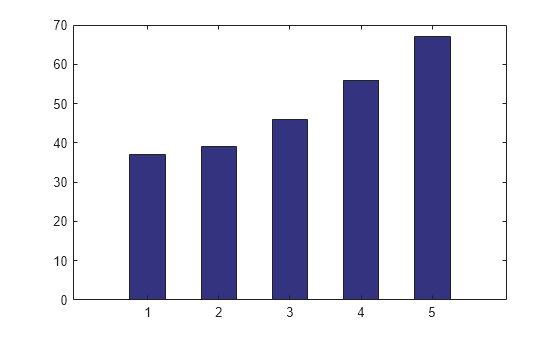
 What kind of graph is this?
Bar Graph
 What do the 3, unmarked lines on this ruler mean?
1/4 inch, 1/2 inch, 3/4 inch.
Which is bigger, 1/2 or 3/4?
3/4 (1/2<3/4)