Vocabulary
Picture Graphs
Bar Graphs
Line Plots
100
What is a tally chart?
a chart that organizes data and uses tally marks to record frequency
100
what are the components of a picture graph? what does a picture graph have?
title, key, pictures
100
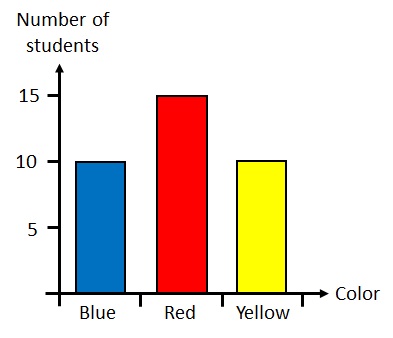
What is the difference between red and yellow?
5 students
100

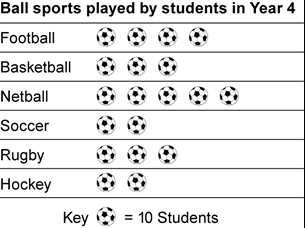
How many students like the most favorite sport?
5 students
200
what is a bar graph?
a graph that uses bars to show data.
200
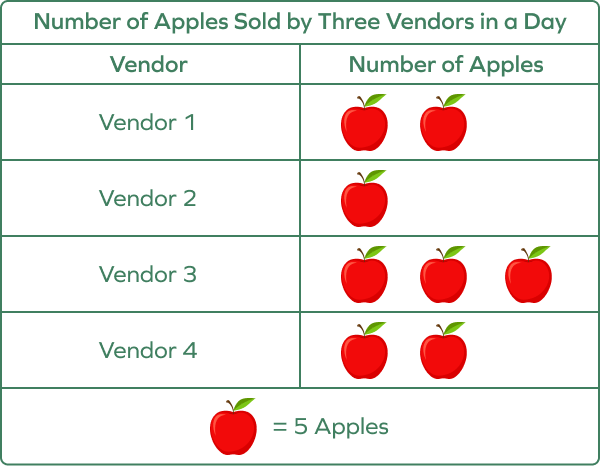
How many apples did Vendor 3 sell?
15
200

How many more does juice have than milk and soda combined?
3 votes
200

Were more cars sold on Monday or Sunday?
Monday
300
What is a key?
a statement showing how many data items each symbol stands for in a picture graph
300

How many MORE students chose apple and banana over grapes and pear? show your work.
16-9= 7 more students
300
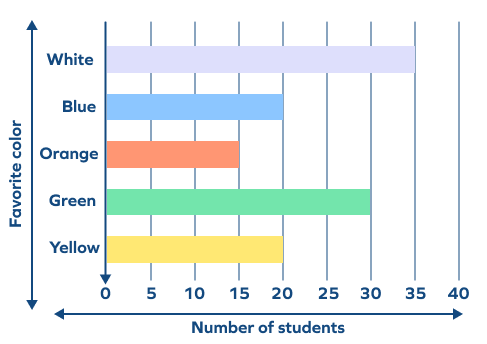 Order the favorite colors from least to greatest
orange, blue/yellow, green, white
300

How many students scored under 45?
16 students
400
What is a scale of a graph?
the relationship between each picture in a picture graph and the number of actual items represented.
400
How many kids played in all?
190 kids
400
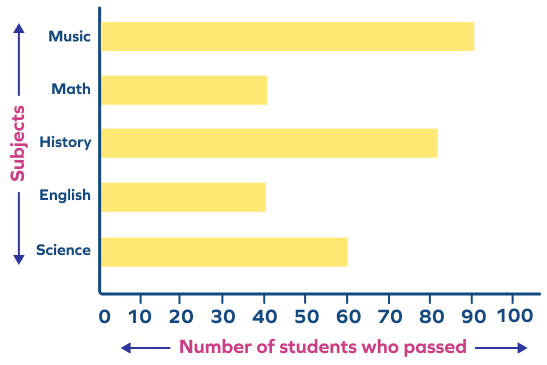
If 10 more students passed math, how would the graph change?
the bar for math would go from 40 to 50.
400

3 students read the same amount of time. How many hours did those students read for?
1 and 2 1/4
500
what is data?
a set of collected values or information
500

1 fish= 4
500
How do bar graphs present data differently than picture graphs?
bar graphs show data by presenting bars of different lengths in graph form. Picture graphs use symbols to show data
500
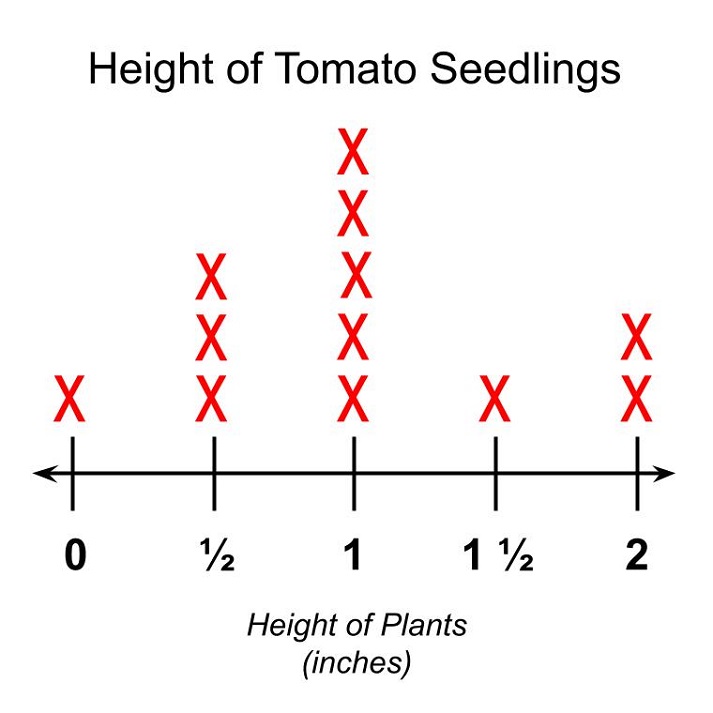
What is the total height of all plants combined?
12 inches