Vocabulary
Measurement
&
Pictograph
&
Pictograph
Tally Chart
Line Plot
Bargraph
100
What is a graph that compares data by using bars of different lengths or heights to show values?
Bar graph
100
What is the length of the button to the nearest half inch?
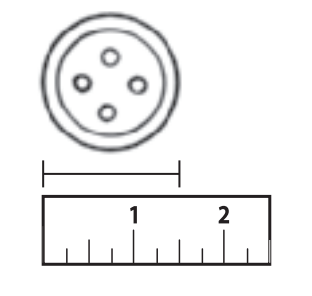
1 ½
100
Which type of book was most popular?

fiction
100
How many friends made 7 or more phone calls?

8 friends
100
Which state is the favorite?

Florida
200
What do you do if you read or study data on a graph called?
Analyze
200
What is the length of the fish to the nearest quarter inch?
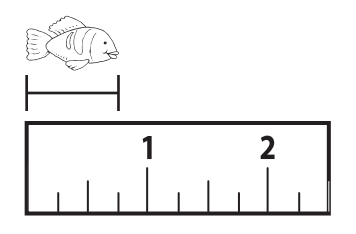
¾ of an inch
200
Frankie made a pictograph using the tally chart below. He used a * as a symbol to represent 3 books. How many symbols would he use to show the number of fiction books borrowed from the library?
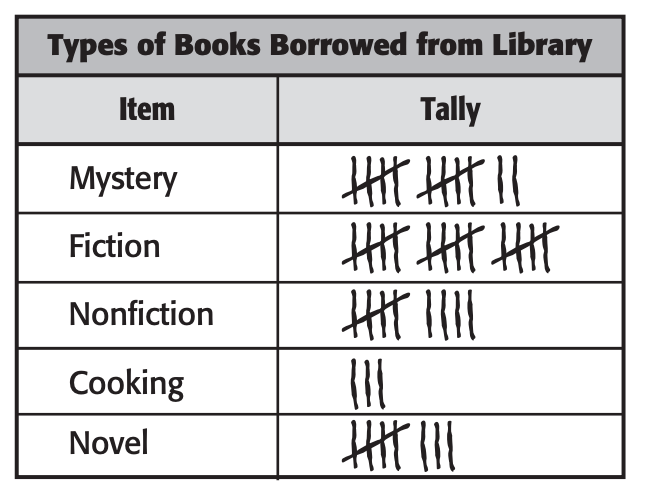
5
200
How many friends made 6 or fewer phone calls?

8 friends
200
How many people like New York and California most?
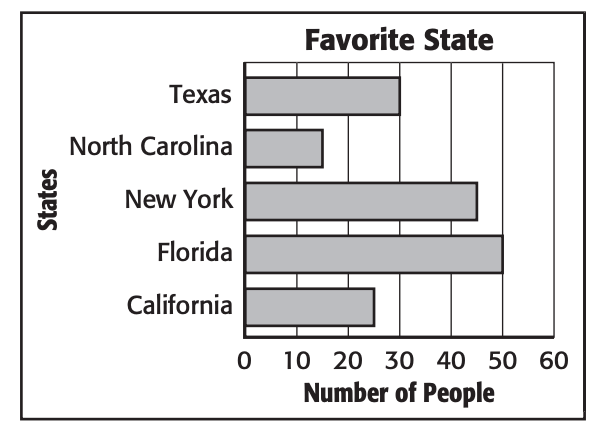
70 people
300
What is a graph that uses the same pictures or symbols to represent data called?
Pictograph
300
Who read the most books?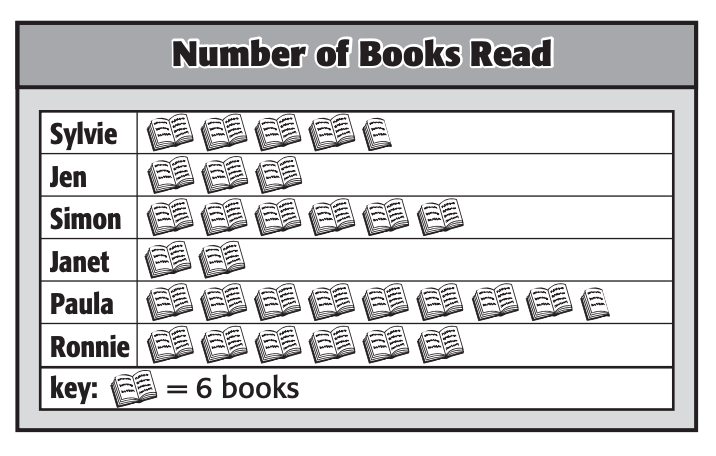
Paula
300
Which size of beetle appeared least frequent?

1/4 inch
300
Which number of phone calls did most friends make?
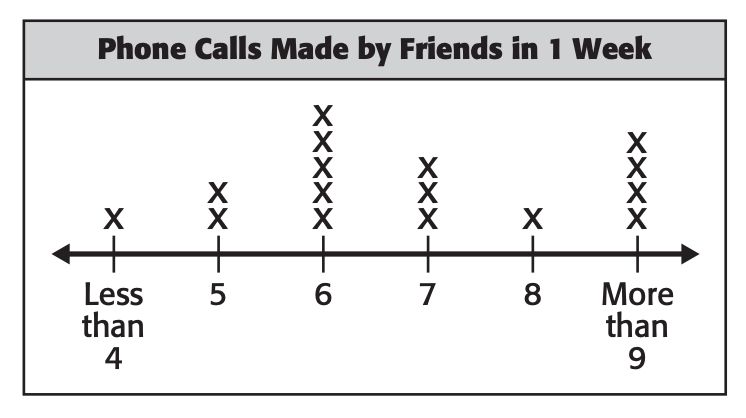
6 calls
300
Which activity is least favorite? How many people like this activity most?
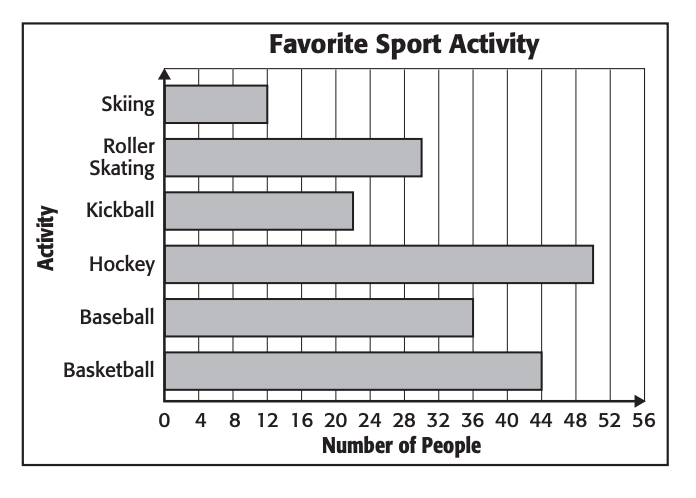
Skiing; 12
400
DOUBLE JEOPARDY!!!! You may wager as many points as you have so far in the game. If you get the question correct, you'll double that many points. If you get the question incorrect, you'll lose that many points.
What is the best way to display the data in the sentence below? Choose from pictograph, bar graph, or line plot.
Mr. Strzok wants to show how often he feeds Jordy.
400
How many books did the the most student read?

51 books
400
How many beetles were measured in all?
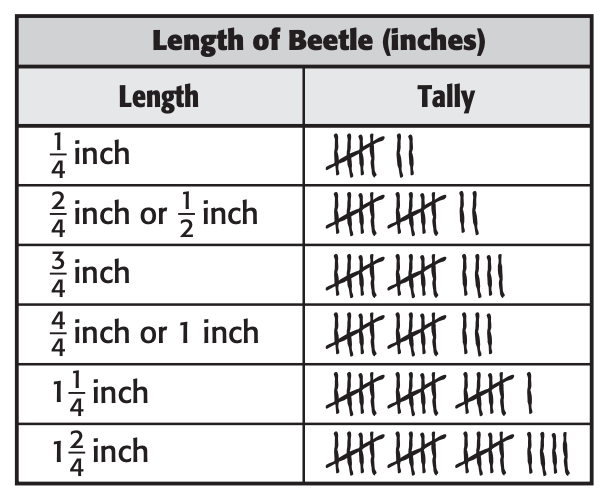
81 beetles
400
How many students have 3 or more pets?

8 students
400
How many people like baseball, kickball, and skiing most?

70 people
500
DOUBLE JEOPARDY!!!! You may wager as many points as you have so far in the game. If you get the question correct, you'll double that many points. If you get the question incorrect, you'll lose that many points.
What is the best way to display the data in the sentence below? Choose from pictograph, bar graph, or line plot.
Mr. Strzok wants to know how many students have a pet cat.
500
How many books did Sylvie, Jen, and Ronnie read altogether?
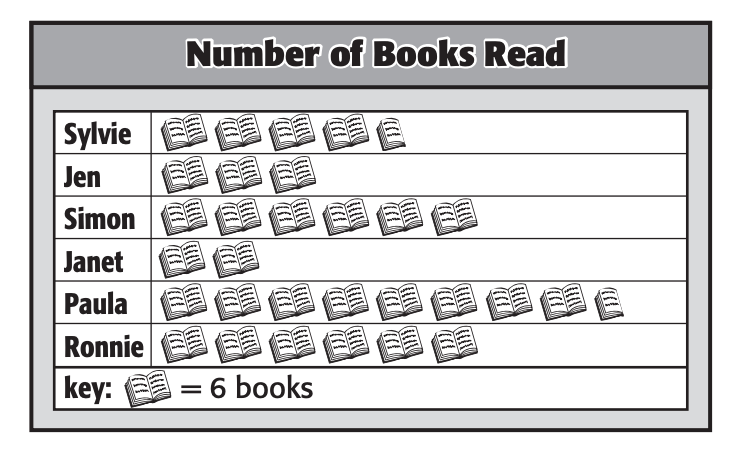
81 books
500
How many more beetles are 1 ½ in. long than ¾ in. long?

5 beetles
500
How many more students have 0 or 1 pet than have 4 or more pets?
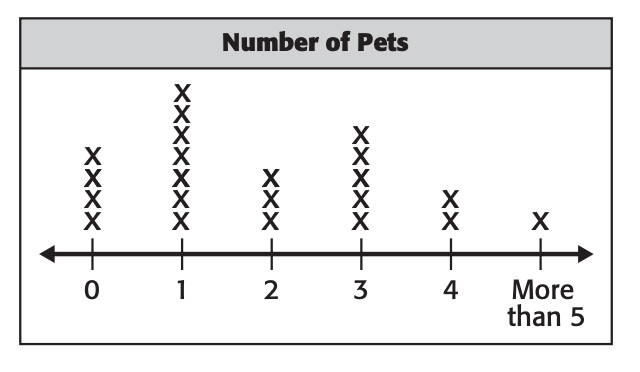
8 students
500
Peggy makes a pictograph using the data on the bar graph above. She uses the symbol & to represent the votes. How many people should her & represent?
4 people