Line Plots & Histograms
Box Plots
Shape of Distributions
Line Graphs
Appropriate Displays
100
True or False.
In a line plot, you can easily see all the individual data points.
True
100
True of False
In a box and whisker plot, it is easy to identify the median of the data set.
True.
100
True of false.
The peak is most similar to the median of a data set.
False- it is most similar to the mode.
100
True of False.
Line graphs are the same as line plots.
False.
100
Which statistical display is best for:
gas mileage of different types of vehicles
Bar graph (categories)
200
True or False
In a histogram, it is easy to see all individual data points.
False
200
True of false.
In a box and whisker plot, it is easy to identify the mode of the data set.
False.
200
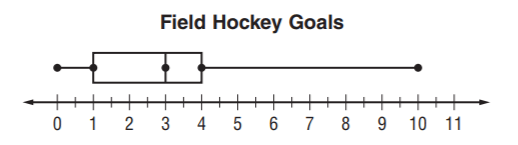
Is the box plot symmetric or non-symmetric?
Non-symmetric
200
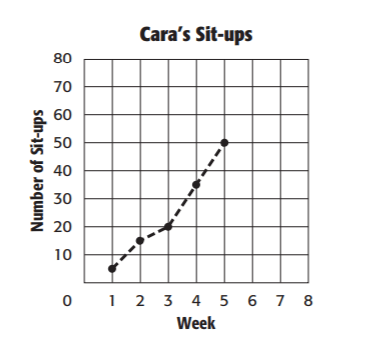
Did the number of sit-ups increase or decrease over the 5 weeks?
Increase
200
Which statistical display is best for:
the weight of a baby from birth to 18 months of age
Line graph (change over time)
300
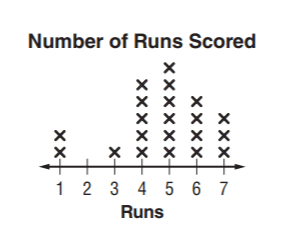
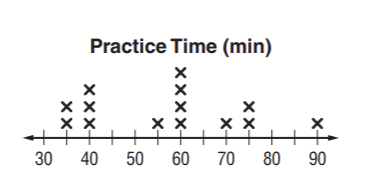
Find the following values of the data set:
Median
Mode
Peak
Gap(s)
Median: 5
Mode: 5
Peak: 5
Gap: 2
300
What percent of the data is below the median?
50%
300
To determine which measure of center (mean or median) and spread (MAD or IQR) to use, you must first determine of the data is symmetric.
When the data IS symmetric, which measures of center and spread should you choose?
Center: Mean
Spread: Mean Absolute Deviaton
300
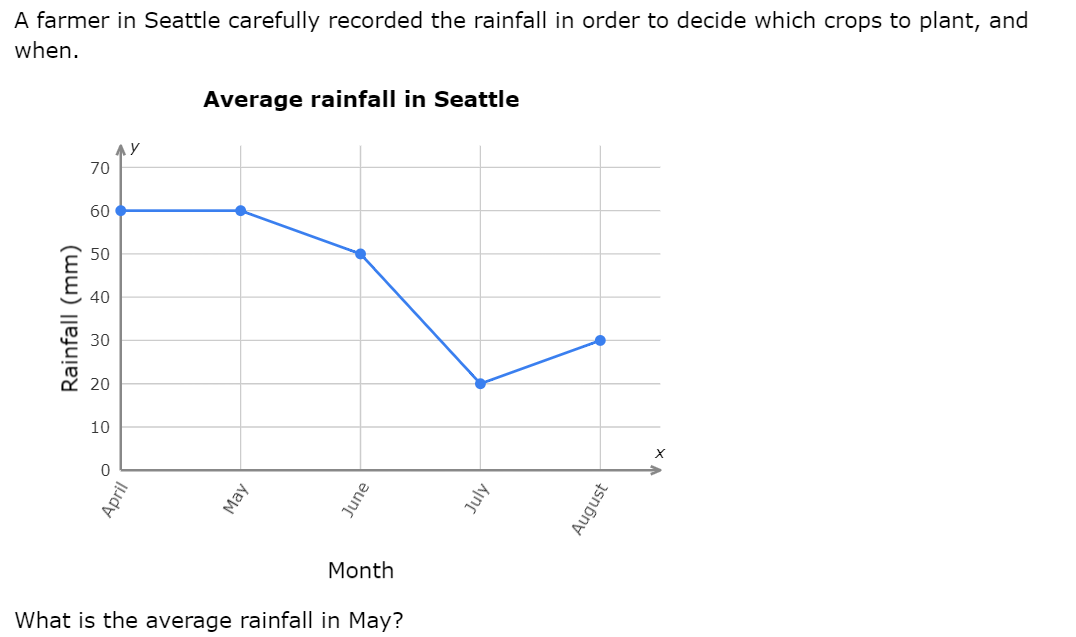
60 mm
300
Which statistical display is best for:
exact test scores of all students in a science class
Line Plot (shows all individual data)
400
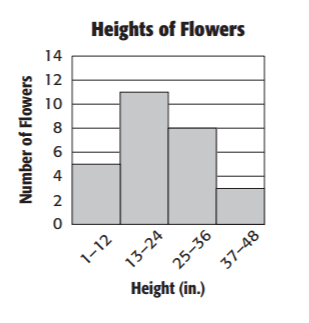
A) What height interval has the lowest frequency?
B) How many flowers are 24 inches tall or shorter?
C) How many flowers are at least 37 inches tall?
A) 37-48
B) 16
C) 3
400
What percent of the data is above the 3rd quartile?
25%
400
To determine which measure of center (mean or median) and spread (MAD or IQR) to use, you must first determine of the data is symmetric.
When the data is NOT symmetric, which measures of center and spread should you choose?
Center: Median
Spread: IQR
400
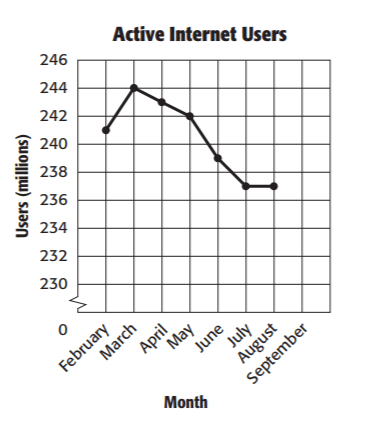
Were there more active users in February or May?
May
400
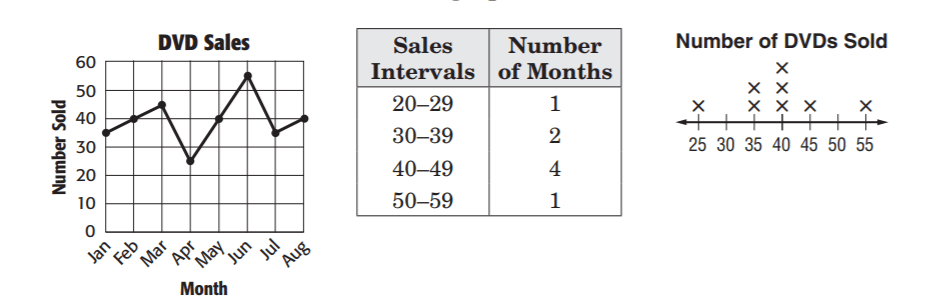
Which display makes it easiest to compare the number of DVDs sold in April to the number of DVDs sold in August?
Line graph
500
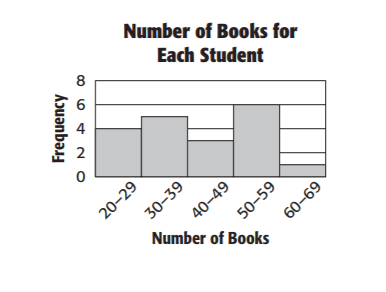
Create a possible data set for the histogram displayed above.
Answer will vary. There needs to be 19 total values.
4 of the values need to be between 20-29
5 of the values need to be between 30-39
3 of the values need to be between 40-49
6 of the values need to be between 50-59
1 of the values needs to be between 60-69
500
Identify the following measures of variation for the data set: minimum, Q1, median, Q3, and maximum
25, 35, 27, 22, 34, 40, 20, 19, 23, 25, 30
Min: 19
Q1: 22
Median: 25
Q3: 34
Max: 40
500
Which measure of center is most appropriate for this distribution? Which measure of spread is most appropriate for this distribution? Justify your reasoning.
Center: Median
Spread: IQR
Justification: These are the best measures of spread to describe a non-symmetrical data set.
500
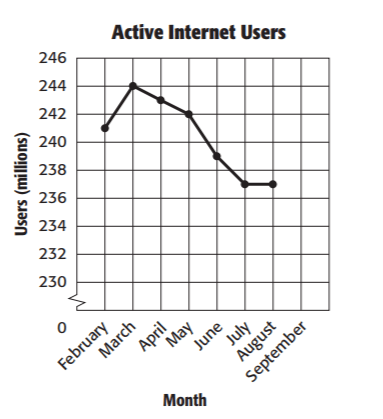
Predict how many active users there will be in October if the trend continues.
a) 234
b) 75
c) 234,000,000
d) 75,000,000
c) 234,000,000
BE CAREFUL TO READ THE TITLE OF THE Y-AXIS!
500
Which display is best to show the frequency of data divided into equal intervals?
Histogram