Stem-and-Leaf Plots (19A)
Grouped Data & Tables (19B)
Histograms & Graphing (19C)
Measures of Centre & Spread (19D)
100
In a stem-and-leaf plot representing two-digit numbers, what do the "stem" and the "leaf" typically represent?
What are the first digit (tens place) for the stem and the last digit (ones place) for the leaf?
100
What general range of total class intervals (bins) is recommended when organizing raw data into a grouped frequency table?
What is between 5 and 10 classes?
100
Name the primary visual difference between a standard column graph (bar chart) and a histogram.
What is that histogram columns touch with no gaps between them?
100
State the statistical formula used to locate the median position in an ordered dataset of
n
items.
What is
(frac{n+1}{2}\)\text{th}
position?
200
This type of stem-and-leaf plot is used to directly compare two similar sets of numerical data side-by-side.
What is a back-to-back stem-and-leaf plot?
200
For continuous measurement data in the class 200–249 mg, what are the real endpoints 199.5 and 249.5 called?
What are the class boundaries?
200
What type of data (e.g., eye color, favorite fast food) uses separated column graphs rather than histograms?
What is categorical data?
200
Five people have an average weight of 67 kg. If a child weighing 25 kg joins them, what is the new group average?
What is 60 kg?
(335 + 25 = 360; 360 / 6 = 60)
300
Looking at the Travel Times plot below, how many students in total were surveyed?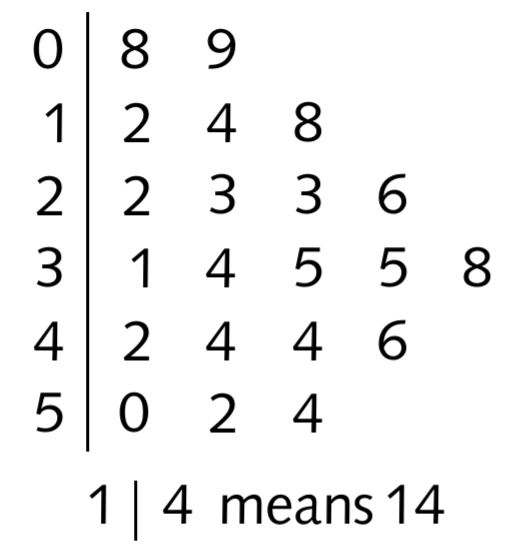
What is 21 students?
300
Based on the Cricket Scores table below, on how many occasions did the batsman score fewer than 20 runs?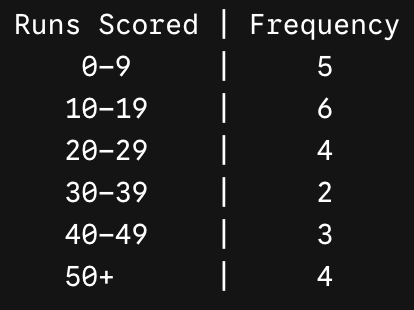
What is 11 occasions? (5 + 6 = 11)
300
Looking at the Exam Mark Histogram below, how many students in total sat for the exam?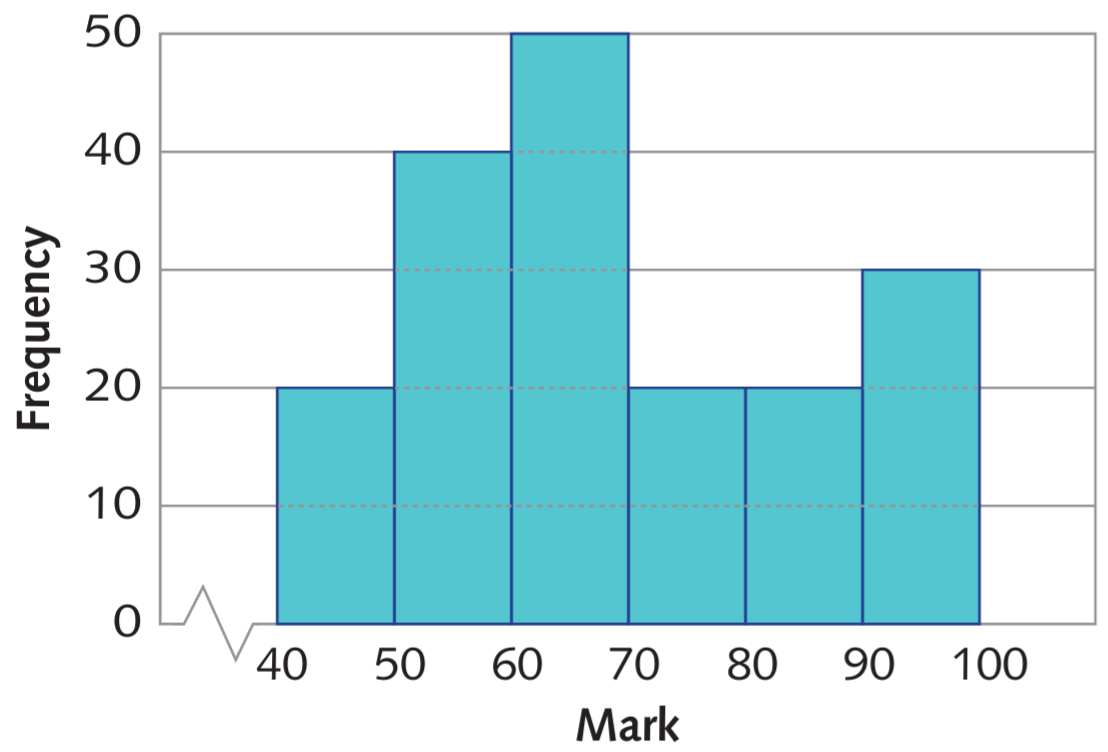
What is 180 students? (
20 + 40 + 50 + 20 + 20 + 30 = 180
)
300
Looking at the Sick Leave graph below, what is the mode of days taken off?
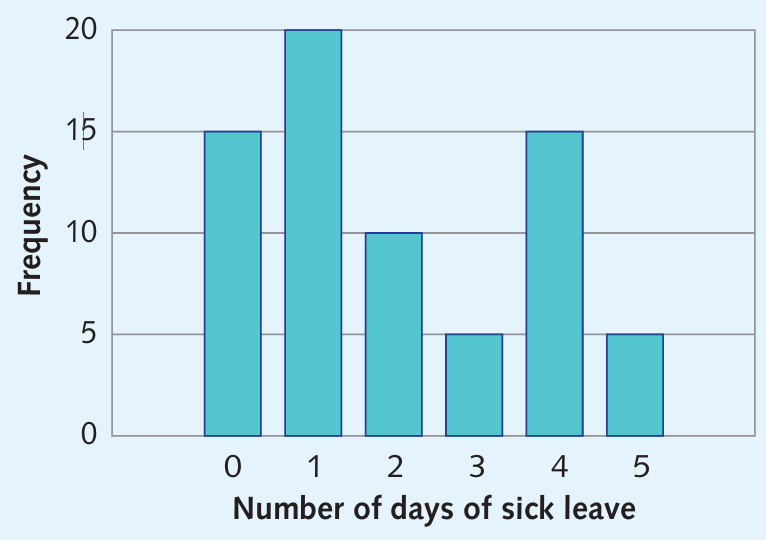
What is 1 day? (Highest frequency column of 20 employees)
400
In a back-to-back stem-and-leaf plot key, if 5 | 7 | 4 represents city vs. country fuel usage in L/100 km, state both original values.
What are 7.5 L/100 km (city) and 7.4 L/100 km (country)?
400
From the Cricket Scores table below, calculate the percentage of innings in which the batsman scored 40 or more runs.
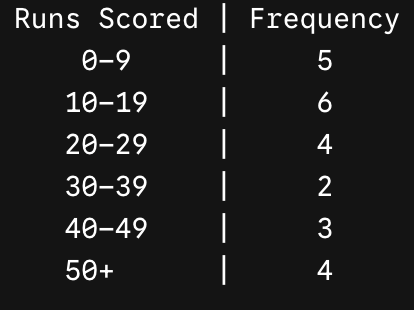
What is 29.17\%? (
\frac{3 + 4}{24} = \frac{7}{24} \approx 29.17\%
)
400
Using the Exam Mark Histogram below, what percentage of students scored 90 or more on the exam?
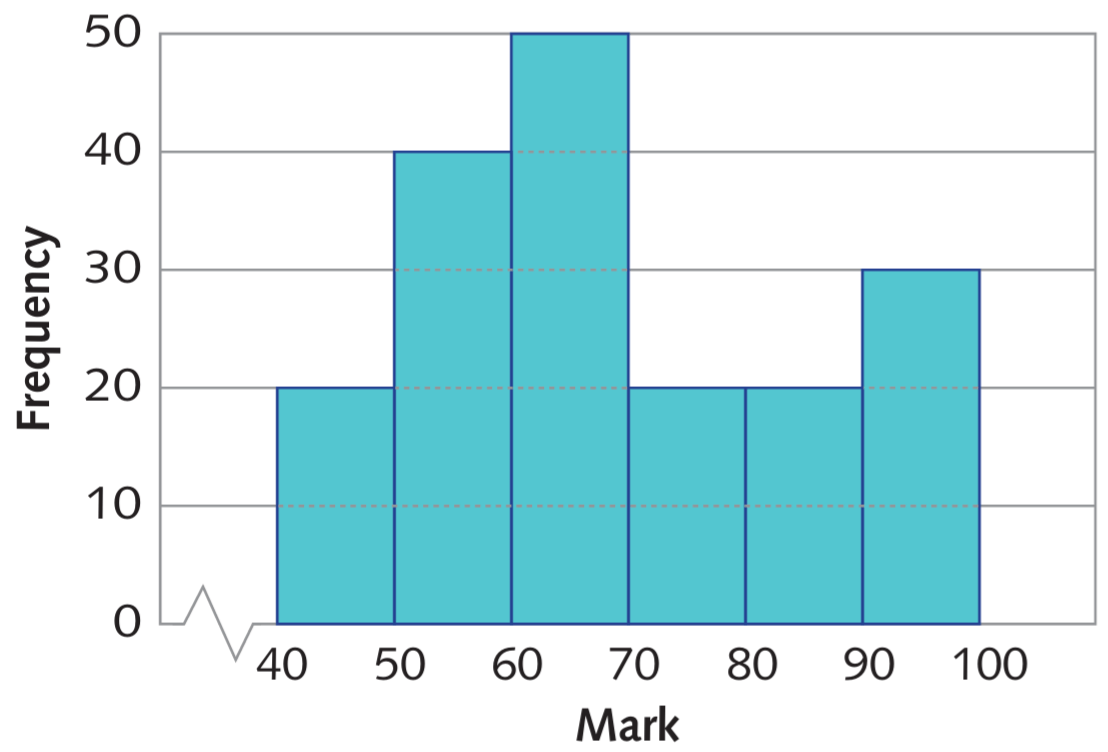
What is 16.67% (or
16\frac{2}{3}\%
)?
(\frac{30}{180} = \frac{1}{6})
400
Using the Sick Leave graph below, determine the median number of sick leave days taken.
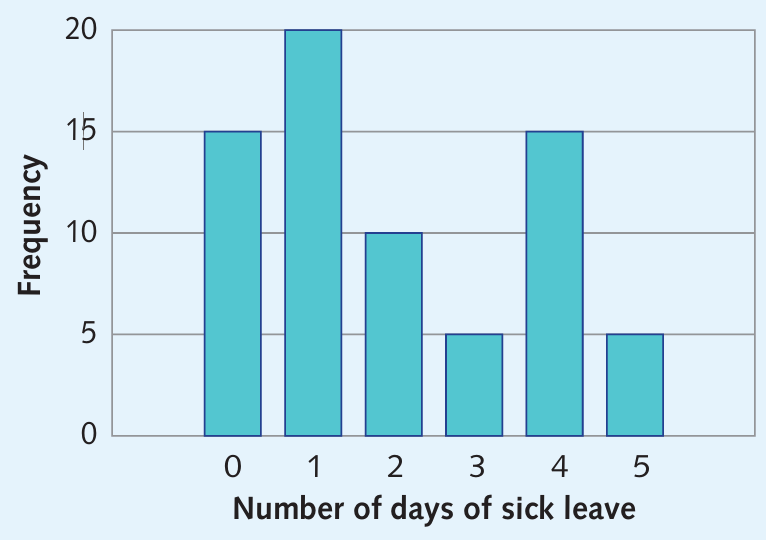
What is 1.5 days? (Total values = 70; average of 35th and 36th values:
\frac{1 + 2}{2} = 1.5
)
500
Using the Travel Times plot below, calculate the median travel time for the class.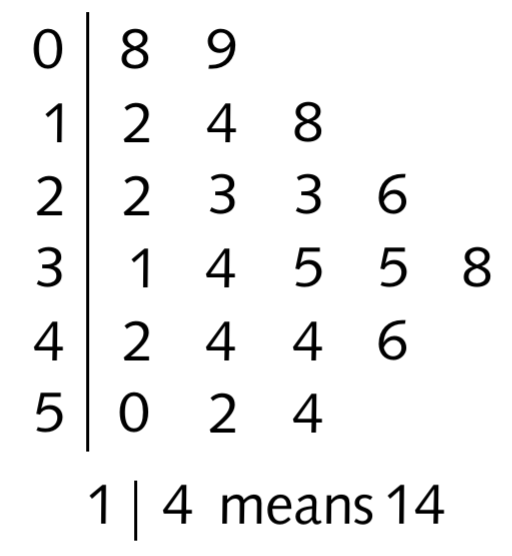
What is 31 minutes? (The 11th value in order)
500
A leaf length is measured at 29.7 mm. If continuous data are grouped into discrete intervals 25–29 and 30–34, which class does 29.7 mm belong to?
What is the 30–34 class (since values round to the nearest whole millimetre)?
500
From the Exam Mark Histogram below, why is it impossible to calculate the exact total score of all students combined?
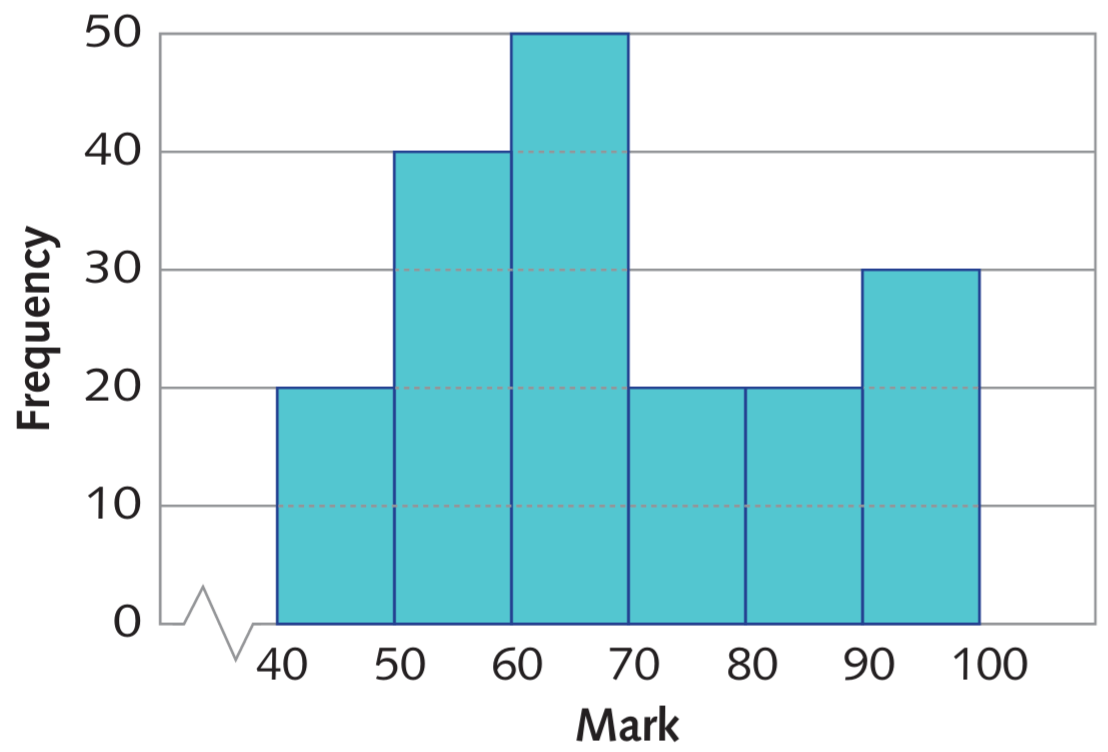
What is because grouping data into class intervals hides individual raw values?
500
A cricketer scored 15, 76, 42, and 27 in his first 4 innings. If his average rises to 42 after the 5th innings, how many runs did he score in that 5th innings?
What is 50 runs? (
frac(160+x)5=42; 42\times 5 = 210; 210 - 160 = 50
)