Enter Category
Enter Category
Enter Category
Enter Category
Enter Category
100
The upper class boundary for the class 120 - 129.
129.5
100
What type of graph is this?
Relative Frequency Histogram
100
The shape of this distribution would be described as __________.
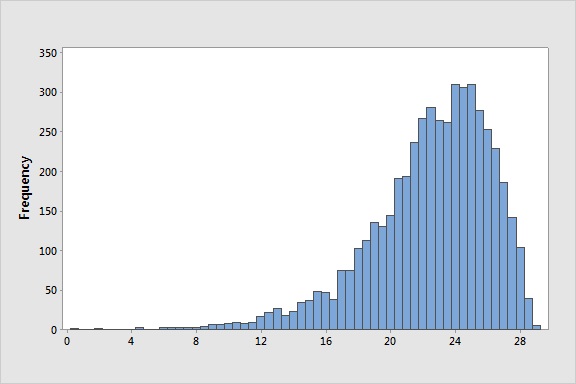
Skewed to the left
100
The straight line that "best" fits the scatterplot of the data.
Regression line
100
For a normal distribution, the percentage of scores lying beween +/- 2 standard deviations.
95%
200
You wish that construct a frequency table for data that ranges between 2 and 46 using 5 classes (intervals). What width should you use for the 5 class intervals.
10
200
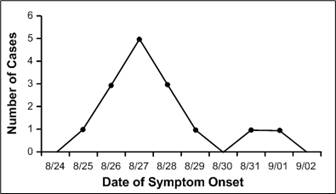
What type of graph is this?
Time-Series Graph
200
For the following Graph, what measure of central tendency would have the greatest value.
Mean, Median, or Mode
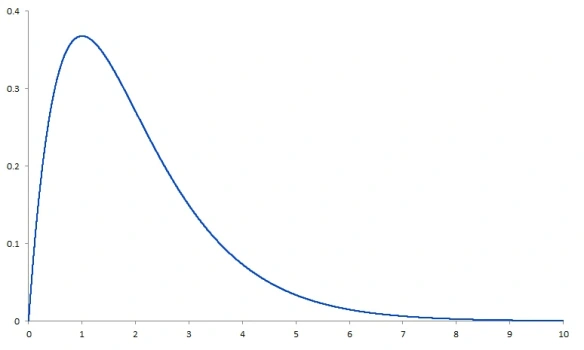
Mean
200
The median for the following set of data:
1, 4, 2, 1, 7, 5
3
200
For a Normal Distribution, the percentage of scores that are below +2 standard deviations.
98%
300
What is the midpoint for the interval 10 - 19.
14.5
300
What type of graph is this?
Frequency Polygon
300
The most accurate measure of central tendency for a skewed distribution.
Median
300
The Mean for the following set of data:
1, 2, 0, 9
3
300
For a normal distribution, the percentage of scores lying between -2 standard deviations and -1 standard deviations.
14%
400
What type of graph is this?

Cumulative Frequency Histogram
400
What type of graph is this?
Dotplot
400
Estimate the correlation for the scatterplot below.

Correlation would be near 0 since the relationship is not linear.
400
The standard deviation for the following sample:
0, 0, 2, 4, 4
2
400
A student got a 75 on assignment 1(worth 10% of their grade), a 100 on assignment 2 (worth 40% of their grade), and a 95 on assignment 3 (worth 50% of their grade). What was the student's average for the class.
95
500
Which type of graph is this?
Pareto Chart
500
Which of the following is a resistant measure of central tendency (less effected by extreme scores)?
Mean or Median
Median
500
Self Esteem and Depression would most likely have a correlation that is __________.
Negative
500
For a normal distribution, the percentage of scores lying between =/- 1 standard deviation.
68%
500
Will viewing these jeopardy boards guarantee you an A on the exam.
NO! Be sure to work examples of every concept and, better yet, explain how you correctly solved a problem to someone else!
Remember....
If you can't say it, you can't do it!