2
3
Misc
100
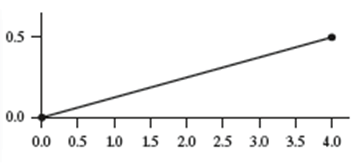
A certain density curve is defined by the line segment that connects the points (0, 0) and (4, 0.5).
(a) Draw a picture of the density curve.
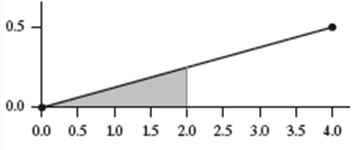
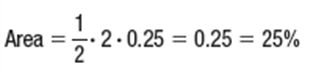
(b) What percent of values will fall between 0 and 2?
(a)
(b)
100
Here are three residual plots of the same data transformed in different ways. Which of the three would be the most appropriate to make a line of least squared regression?
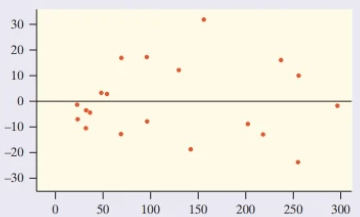
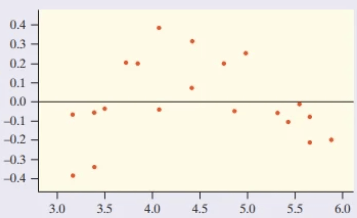
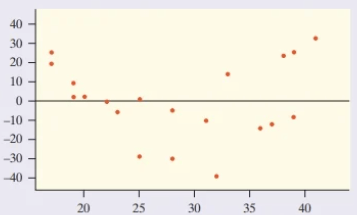
The residual plot for Option 1 is much more scattered, while the residual plots for Option 2 and 3 are obviously curved or roughly curved, meaning that the first model is the most appropriate.
100
The cumulative relative frequency graph shows the distribution of median household incomes for the 50 states and the District of Columbia in a recent year. Use the cumulative relative frequency graph for the state income data to answer each question. At what percentile is California, with a median household income of $57,445?

California is at about the 78th percentile for household income
200
The cumulative relative frequency graph shows the distribution of median household incomes for the 50 states and the District of Columbia in a recent year. Use the cumulative relative frequency graph for the state income data to answer each question. Estimate and interpret the IQR of this distribution.

The first quartile of this distribution is the 25th percentile. About 25% of states have median incomes less than or equal to $45,000. The 75th percentile is less than or equal to $75,000. So, the IQR = Q3 - Q1 = 75,000 - 45,000 = $30,000
So the range of the middle 50% of data in the distribution of median household income per state is about $30,000.
200
The scatterplot shows the relationship between the number of people per television set and the number of people per physician for 40 countries, along with the least-squares regression line. In Ethiopia, there were 503 people per TV and 36,660 people per doctor. Which of the following is correct?
(a) Increasing the number of TVs in a country will attract more doctors.
(b) The slope of the least-squares regression line is less than 1.
(c) The correlation is greater than 1.
(d) The point for Ethiopia is decreasing the slope of the least-squares regression line.
(e) Ethiopia has more people per doctor than expected, based on how many people it has per TV.
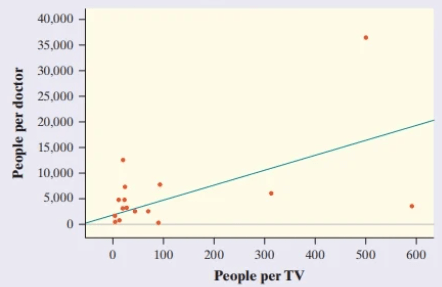
e. Ethiopia has more people per doctor than expected, based on how many people it has per TV.
200
Which of the following statements is not true of the correlation r between the lengths (in inches) and weights (in pounds) of a sample of brook trout?
(a) r must take a value between −1 and 1.
(b) r is measured in inches.
(c) If longer trout tend to also be heavier, then r > 0.
(d) r would not change if we measured the lengths of the trout in centimeters instead of inches.
(e) r would not change if we measured the weights of the trout in kilograms instead of pounds.
(b) r is measured in inches. Is FALSE because r is unit free
300
Three landmarks of baseball achievement are Ty Cobb’s 0.420 batting average, Ted Williams’s 0.406, and George Brett’s 0.309. These batting averages cannot be compared directly because the distribution of major league batting averages has changed over the years. Here are the facts: Decade Mean Standard deviation for each player respectively. Find the standardized scores for Cobb, Williams, and Brett. Who had the best performance for the decade he played?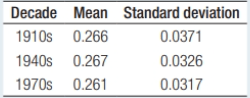
Cobb = 4.15
Williams = 4.26
Brett = 4.07
All three hitters were at least 4 standard deviations above their peers, but Williams’s z-score is the highest
300
Long-term records from the Serengeti National Park in Tanzania show interesting ecological relationships. When wildebeest are more abundant, they graze the grass more heavily, so there are fewer fires and more trees grow. Lions feed more successfully when there are more trees, so the lion population increases. Researchers collected data on one part of this cycle, wildebeest abundance (in thousands of animals), and the percent of the grass area burned in the same year.
(a) Give the equation of the least-squares regression line. Be sure to define any variables you use.
(b) What is the predicted value of percent of grass burned when there are 750k Wildebeests
(c) Interpret the standard deviation of the residuals and r^2.
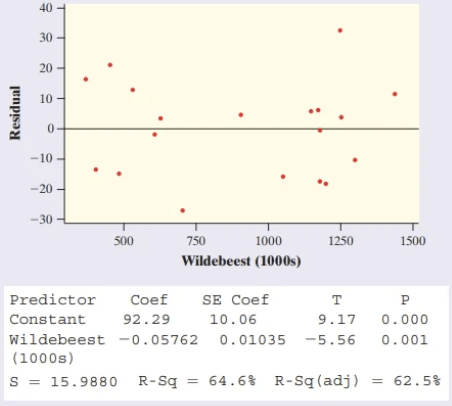
a. y = 92.29 - 0.05762x
y = predicted percent of the grass area burned
x = wildebeest abundance (in thousands)
b. y = 92.29 - 0.05762(750) = 49.075
c. The actual percentage of burned area is typically about 15.988% away from the percent predicted by the least-squares regression line with x = number of wildebeest (1000s). The value of r^2 = 64.6%. Interpretation: About 64.6% of the variability in percentage of burned area is accounted for by the least-squares regression line with x = number of wildebeest (1000s).
300
Chapter 1 quiz scores from Mr. Pastori’s 1-2B class follow an approximately Normal distribution with a mean of 81 and standard deviation of 6.
(a) About what percent of students scored less than 93 on the Chapter 1 test?
(b) A student who scored a 68 would be at about what percentile of the distribution?
(a) 97.5% of students scored less than 93
(b) About the 1.5th percentile because about 100% − 98.5% = 1.5% of students scored less than or equal to 68
400
The amount of sleep that elementary school children get per night follows a Normal distribution with a mean of 9.5 hours and a standard deviation of 0.55 hours.
(a) Find the proportion of elementary school children who get between 9 and 10 hours of sleep per night. Sketch the Normal curve and shade the area under the curve that is the answer to the question.
(b) Is it unusual for an elementary school student to get at least 12 hours of sleep? Justify your answer
(a) normalcdf(lower: 9, upper: 10, mean: 9.5, SD: 0.55) = 0.637
About 63.7% of elementary school children get between 9 and 10 hours of sleep per night
(b) normalcdf(lower: 12, upper: 1000, mean: 9.5, SD: 0.55) ≈ 0
It is definitely unusual for an elementary school student to get at least 12 hours of sleep per night. About none of the students get this much sleep per night.
400
Sarah’s parents are concerned that she seems short for her age. Their doctor has kept the following record of Sarah’s height.
a. Using your calculator, find the equation of the least-squares regression line.
b. Calculate and interpret the residual for the point when Sarah was 48 months old.
c. Would you be confident using the equation from part (a) to predict Sarah’s height when she is 40 years old? Explain.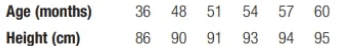
a. The regression line for predicting y = height from x = age is y = 71.95 + 0.3833x.
b. At age 48 months, we predict Sarah’s height to be y = 71.95 + 0.3833(48) = 90.348 cm. The residual for Sarah is 90 - 90.348 = 0.348. Interpretation: Sarah’s actual height was 0.348 cm less than the height predicted by the regression line with x = 48 months.
c. No; obviously, the linear trend will not continue until she is 40 years old. Our data were based only on the first 5 years of life and predictions should only be made for ages 0–5.
400
Dione’s favorite exercise machine is a stair climber. She decides to explore the relationship between how long she works out on the stair climber (in minutes) and the number of floors it tells her that she has climbed. Dione records minutes of climbing time and number of floors climbed for six exercise sessions. Interpret standard deviation of the residuals and the coefficient of determination of this data.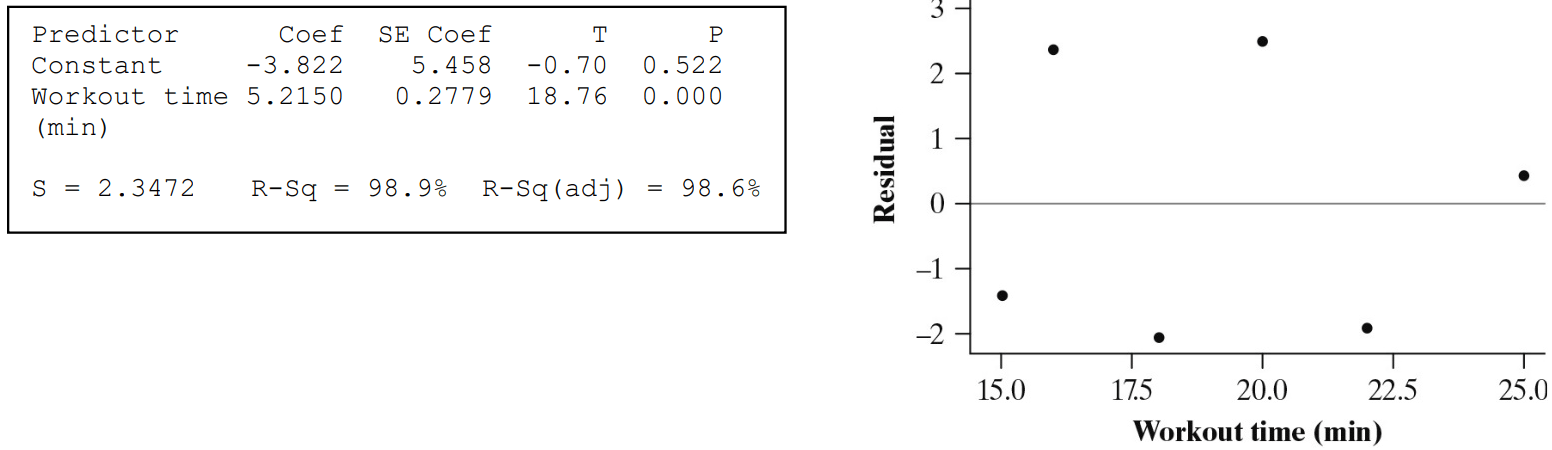
s: The actual number of floors climbed is typically about 2.3472 floors away from the number predicted by the least-squares regression line with x = workout time (min).
r^2: About 98.9% of the variability in number of floors climbed is accounted for by the least-squares regression line with x = workout time (in minutes)
500
The average yearly snowfall in Chillyville is approximately Normally distributed with a mean of 55 inches. If the snowfall in Chillyville exceeds 60 inches in 15% of the years, what is the standard deviation?
The value 1.04 is the approximate 85th percentile of the standard Normal distribution
So 1.04 = 60 - 55/sd
sd = 4.81
500
Below is computer output for three different regression models examining this relationship for countries in Central and South America. Child mortality is measured in deaths before age 5 per 1000 children born, and income is measured in U.S. dollars per person. All logarithms are base 10. Pick the correct model to predict the child mortality rate in a country with an income of $1300 per person.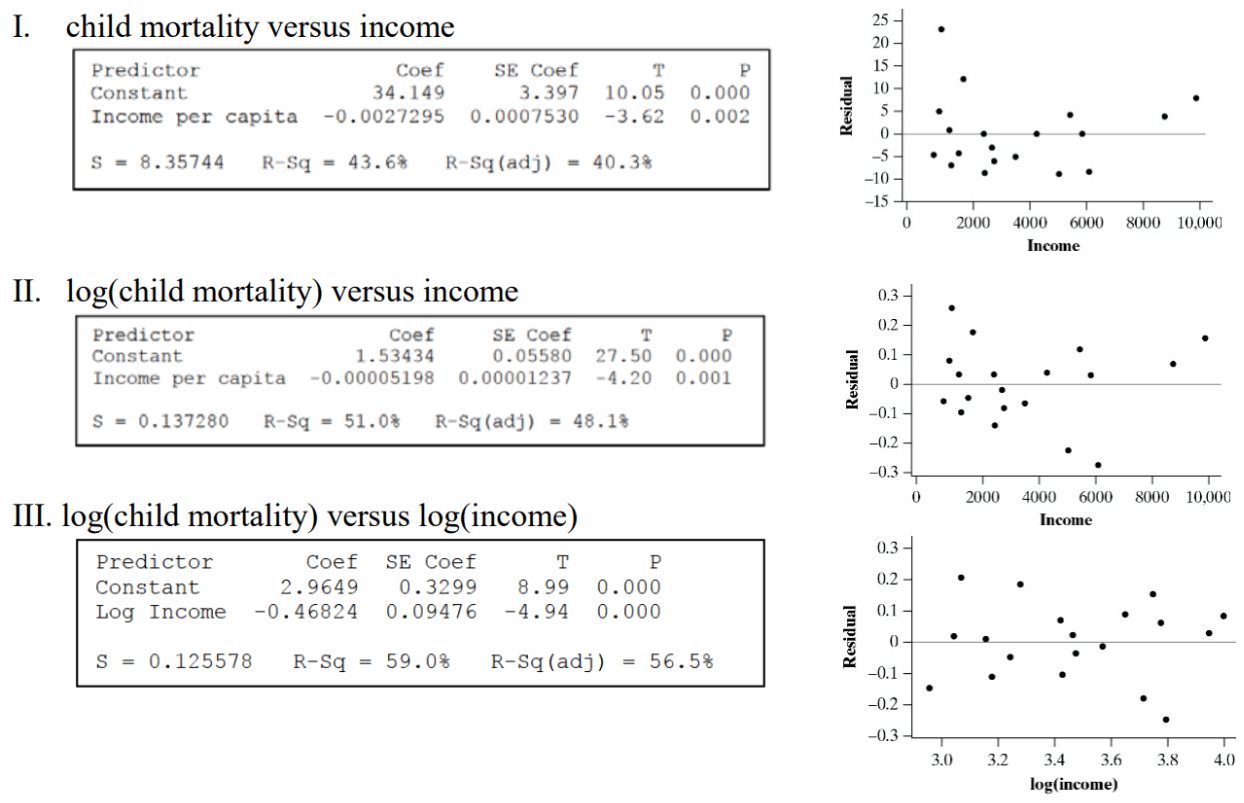
Model III, which uses y = log(child mortality) and x = log(income) best summarizes the relationship between income and child mortality because this model shows the most random scatter of points on either side of the line residual = 0. This model also has the greatest value of r^2.
For a country with an income of $1300 per person, log(child mortality) = 2.9649 – 0.4682*log(1300) = 1.507. So, the predicted child mortality = 10^1.507 ≈ 32.14 deaths per 1000 children under age 5.
500
At one particular restaurant, large drink cups require lids with a “diameter” of between 3.95 and 4.05 inches. The restaurant’s lid supplier claims that the diameter of its large lids follows a Normal distribution with mean 3.98 inches and standard deviation 0.02 inch. The supplier is considering two changes to reduce to 1% the percentage of its large-cup lids that are too small. One strategy is to adjust the mean diameter of its lids. Another option is to alter the production process, thereby decreasing the standard deviation of the lid diameters.
(a) If the standard deviation remains at σ = 0.02 inch, at what value should the supplier set the mean diameter of its large-cup lids so that only 1% are too small to fit?
(b) If the mean diameter stays at μ = 3.98 inches, what value of the standard deviation will result in only 1% of lids that are too small to fit?
(c) Which of the two options in parts (a) and (b) do you think is preferable? Justify your answer.
(a) invNorm(area: 0.01, mean: 0, SD: 1) = -2.33. Solving -2.33 = (3.95 - mean)/0.02 gives mean = 4.00 inches.
(b) invNorm(area: 0.01, mean: 0, SD: 1) = -2.33. Solving -2.33 = (3.95 - 3.98)/SD gives SD = 0.013 inch.
(c) We prefer reducing the SD, as in part (b). This will reduce the number of lids that are too small and the number of lids that are too big. If we make the mean a little larger, as in part (a), we will reduce the number of lids that are too small, but we will increase the number of lids that are too big.