3.1 Functions
3.2 Linear Functions
3.3 Function Notation
100
The point (2, -3) would be in which quadrant on a graph?
Quadrant 4
100
Describe the graph of a linear function.
A linear function is a function whose graph is a nonvertical line.
100
Fill in the blank.
"Function notation does not imply _____. "
a. Addition
b. Subtraction
c. Multiplication
d. Division
c.
Function notation does not imply multiplication.
200
On a graph, which direction does the x axis go?
On a graph, which direction does the y axis go?
X axis goes left and right
Y axis goes up and down.
200
Does the equation represent a linear or non linear function? Explain
y = x + 9
The equation represents a linear function. There is a constant rate of change. +9
200
Evaluate f(x) = -4x + 7 when x = 2 and when x = -2
f(2) = -1
f(-2) = 15
300
Determine whether the relation is a function or not. Explain.
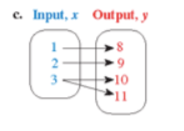
Not a function. The input "3" has multiple outputs.
300
Does the graph represent a linear or non-linear function?
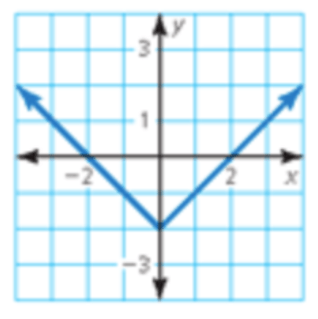
Non linear. The graph is not a straight line.
300
Find the value of x so that the function has the given value.
f(x) = 6x + 9 ; f(x) = 21
x = 2
400
Using the vertical line test, determine if the graph show represents a function or not. Explain.
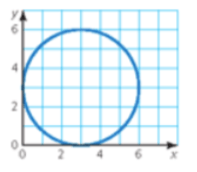
The line touches the graph twice so it is not a function.
400
Does the table represent a linear or non-linear function?
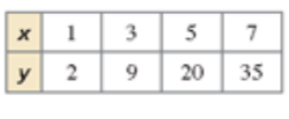
Non linear. There is not a constant rate of change.
400
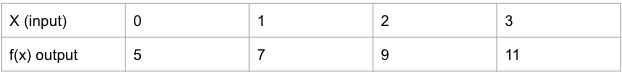
Using the inputs 0, 1, 2, 3 make an input-output using the function f(x) = 2x + 5
500
Fill in the blank
The variable that represents the output values of a function is the __________ variable because it depends on the value of the independent variable.
The variable that represents the output values of a function is the dependent variable because it depends on the value of the independent variable.
500
Correct the mistake made
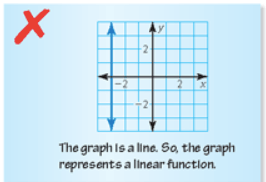
The graph is a vertical line so it is not a function. A linear function has a graph that is a nonvertical line.
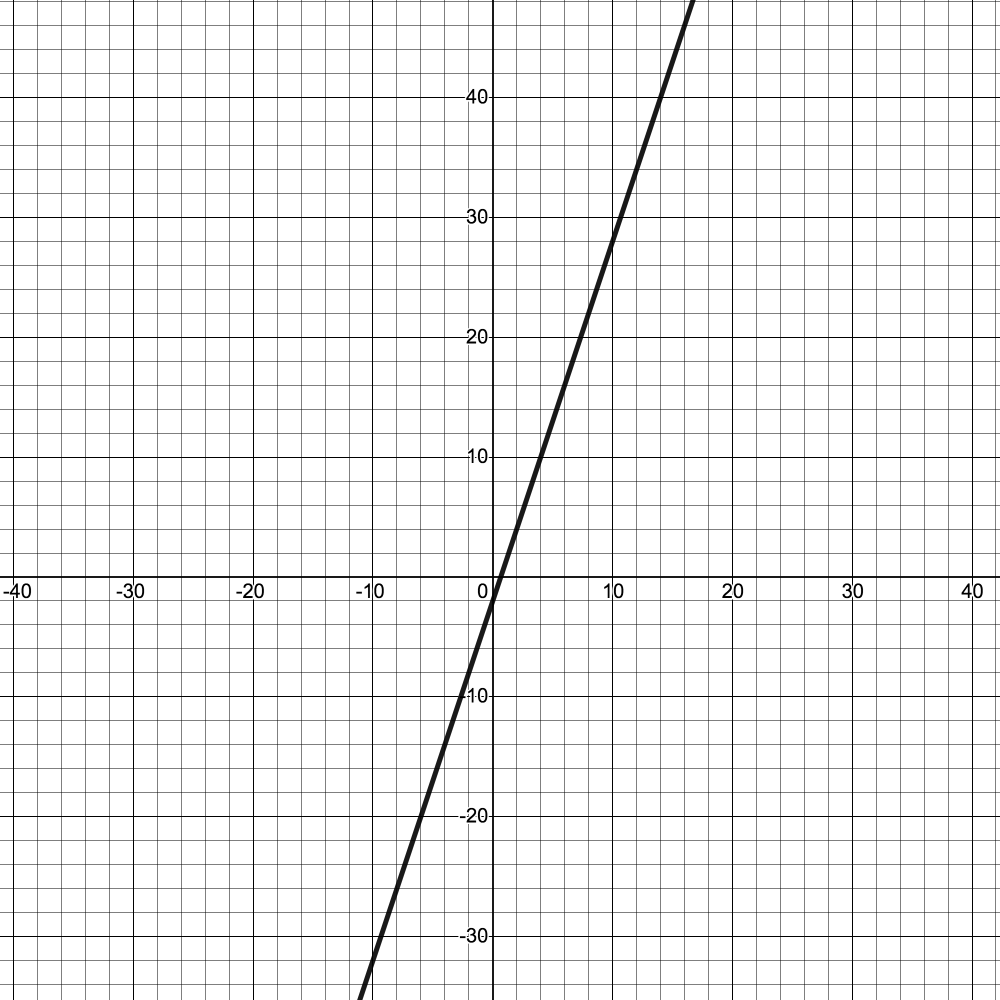
500
Graph the linear function f(x) = 3x - 2