Scatter Plots
Line of Best Fit
Ti-84
Residuals
Correlation Coefficient
100
What type of graph displays the relationship between two numerical variables?
What is a scatter plot?
100
What is the purpose of a line of best fit?
To model the relationship between two numerical variables and make predictions.
100
Which calculator menu allows you to enter data into lists L1 and L2?
What is STAT → EDIT?
100
What is a residual?
What is the difference between the actual and predicted value?
100
What is the range of possible correlation coefficients?
What is −1 to 1, inclusive?
200
A scatter plot shows points rising from left to right. What type of association does it show?
What is a positive association?
200
Find the slope of the line passing through (2, 60) and (6, 80).
What is 5?
200
What do the values a and b represent in the calculator's regression equation y = ax+b?
a = slope, b = y-intercept.
200
The actual value is 15 and the predicted value is 12. Find the residual.
What is 3?
Proof: 15-12 = 3
200
What does a correlation coefficient of r = 0.95 indicate?
What is a strong positive linear correlation?
300
A scatter plot shows a strong negative association. What happens to the y-values as the x-values increase?
What is the y-values generally decrease.
300
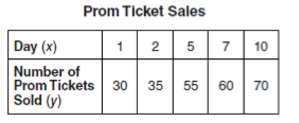
Using the table, find the linear regression equation with your TI-84.
(round to the nearest hundredth)
What is y = 4.45x + 27.31
300
Which regression command calculates a linear regression equation?
What is LinReg(ax+b)? Found under STAT → CALC → 4 → Calculate
300
A line of best fit is represented by:
y = 4x+10
If x = 5 and the actual value is 35, find the residual.
What is 5?
[Proof: 4(5) + 10 = 30 (estimation)
actual value - estimation = residual
35 - 30 = 5]
300
A dataset has r = -0.12. Describe the strength and direction of its linear association.
What is a very weak negative linear correlation?
400
Two scatter plots are shown. Plot A has points tightly clustered around a straight line. Plot B has points widely scattered around a straight line.
Which plot has the stronger linear association? Explain.
Plot A, because its points are more closely clustered around a straight line.
400
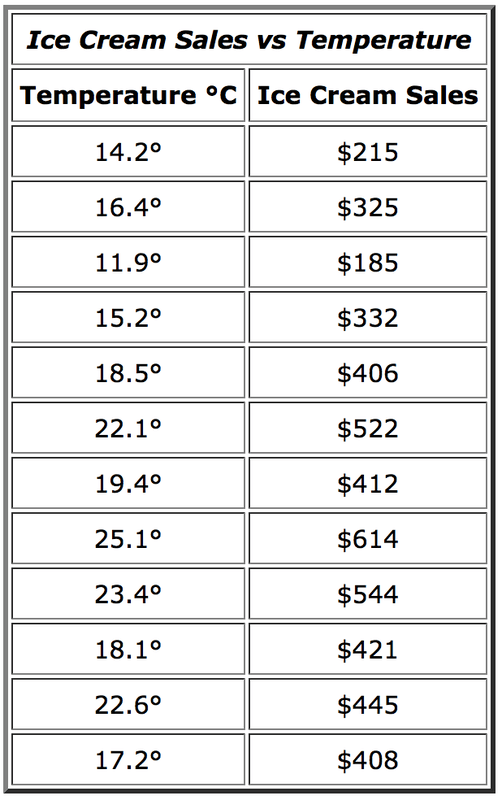
Using the table, find the linear regression equation with your TI-84.
(round tot he nearest hundredth)
What is y = 30.09x - 159.47
400
A student uses LinReg(ax+b) on their TI-84 and receives:
a = 3.75, b = 12.5
Write the regression equation and predict y when x = 6.
What is 35?
Proof: y = 3.75x +12.25 [equation]
y = 3.75(6) +12.25
400
A student uses the line of best fit:
y = 3x+5
When x = 6, the actual value is 18.
The student claims the residual is +5.
Are they correct? Why?
The student subtracted in the wrong order. The residual is negative because the model overestimated the actual value.
3(6) + 5 = 23
18 - 23 = -5
400

Examine the scatter plot. Does it show a positive, negative, or no linear association? Explain your reasoning.
There is no apparent linear association because the points are randomly scattered without a clear upward or downward trend.
500
A scatter plot shows a positive association between the number of hours students study and their exam scores. Does this prove that studying causes higher exam scores? Explain. (Yes or No)
What is No. Correlation does not prove causation.
500
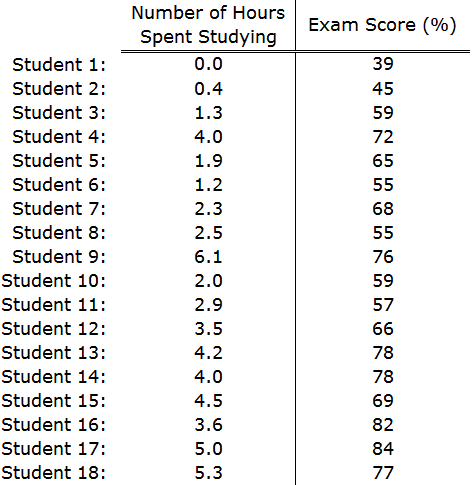
Using the table, find the linear regression equation with your TI-84.
(round tot he nearest hundredth)
What is y = 6.38x + 46.38
500
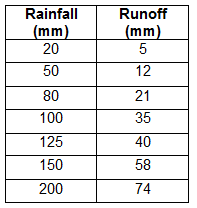
Using the table, find the linear regression equation with your TI-84. Then predict the amount of runoff when rainfall reaches 300 mm. (round to the nearest hundredth)
What is 113.24 mm
Proof: y = .4x - 6.76 (found in calculator)
Plug in 300 for x
y = .4(300) - 6.76 = 113.24mm
500
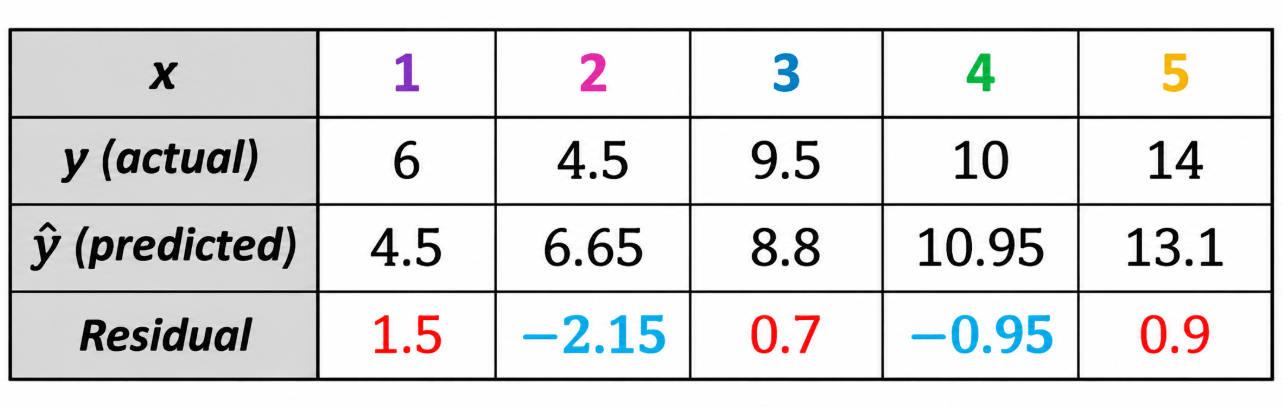
Using the table provided, identify the largest positive residual and the largest negative residual. Then determine which residual is farthest from zero.
Largest positive residual: 1.5 (x = 1)
Largest negative residual: −2.15 (x = 2)
Farthest from zero: −2.15
500
Two datasets have correlation coefficients of r = 0.91 and r = -0.97. Which has the stronger linear relationship, and why?
What is −0.97? It represents the stronger linear relationship because |-.97| > |.91}