Domain and Range
Dep and Ind
f(x)
Scatterminded
Arithmetic Seq
100

Given the above, this is {5,10,15}
What is the Domain?
100
This is the variable that I control and can manipulate.
What is independent variable?
100
This is what f(x) means.
What is function of x?
100
This graph is an example of this type of correlation.
:max_bytes(150000):strip_icc()/dotdash_Final_Inverse_Correlation_Dec_2020-01-c2d7558887344f5596e19a81f5323eae.jpg)
What is negative correlation?
100
This is the common difference of the following:
22, 28, 34, 40...
What is 6?
200
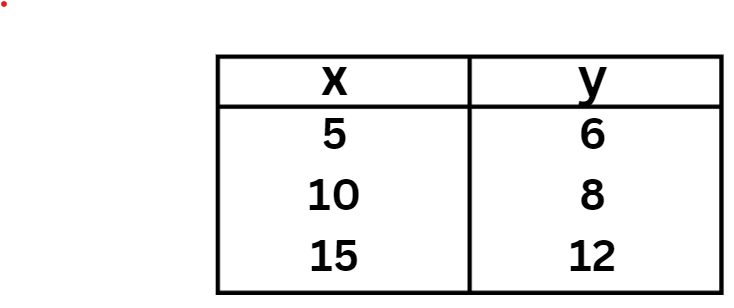
Given the above, this is {6,8,12}
What is range?
200
This is the variable that I do not control, and is based off the variable I control.
What is dependent?
200
This is what makes the following a function.

What is each x goes to one y?
200
This is an example of this type of correlation.
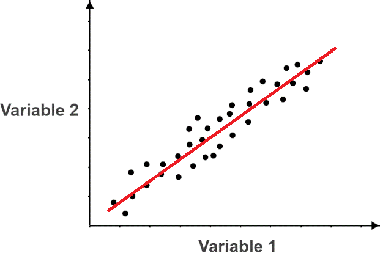
What is positive correlation?
200
This is the common difference of the following:
75, 65, 55, 45...
What is -10?
300

This is the domain of the graph above.
What is {4,7,9}?
300
Limes at the grocery store cost 41 cents each. This is the independent variable.
What is the number of limes I buy?
300
This is what makes this not a function.
What is 6 goes to 1 and 3?
300
This is an example of this type of correlation.

What is no correlation?
300
This is the next term of the sequence:
15, 22, 29, 36...
What is 43
400
This is the range of the above graph.
What is {4,6,7}
400
Limes at the grocery store cost 41 cents each. This is the dependent variable.
What is the cost?
400
This is f(2) of f(x) = 2x - 4
What is 0?
400
This is what we call the red line on this scatterplot.
What is a trendline.
400
This is the 50th term of the following.
2, 5, 8, 11...
What is 149?
500
This is the values of a and b, when looking at the domain of this function:
a\leqx\leqb
What is -5 and 2?
500
This is the independent variable in the following: I can run a mile in 8 minutes.
What is how many miles I run?
500
This is f(-3) of f(x) = |x+1| + 4
What is 6?
500
This is the value the trendline predicts our y value to be at x = 25.

What is y = 22.5? (I would accept anything from 20-25)
500
This is the 32nd term of the following:
56, 54, 52, 50...
What is -6?