Sampling Methods
Stem and Leaf Plot
Mean, Median, Mode & Range
Box and Whisker Plot
Displaying Data
100
What is random sampling?
by chance or completely random
100
At what place value do we separate the number in order to correctly place it on a stem and leaf plot?
between the tens and ones
100
What is the mode?
the number that occurs the most
100
What pieces of information do you need in order to plot a box and whisker on a number line? (name the 5)
smallest value
largest value
median
Q1
Q3
100
True or false... on a histogram do the bars need to be touching?
True! That is what makes it a histogram rather than a bar graph
200
What is systematic sampling?
according to a rule or system
200
List the values from the stem and leaf plot
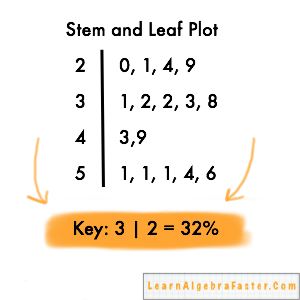
20, 21, 24, 29, 31, 32, 32, 33, 38, 43, 49, 51, 51, 51, 54, 56
200
What is the median?
The number in the middle after putting them in least to greatest order
200
Name the values in the box and whisker plot. 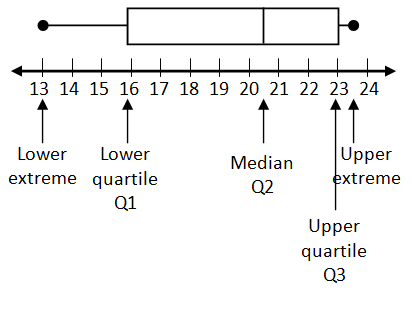
smallest: 13
lower Q: 16
median: 20.5
upper Q: 23
largest: 23.5
200
True or false.... A line graph shows changes over time?
True!
300
What is stratified sampling?
a group within another sub group
300
List the values in the stem and leaf plot.

68, 75, 77, 79, 80, 82, 92, 96, 96, 97
300
What is the mean?
The sum of all the numbers divided by the number of values
300
Name the values in the box and whisker plot.

smallest: 10
lower Q: 25
median: 35
upper Q: 45
largest: 60
300
What are the 3 types of correlation?
positive, negative and none
400
Identify the sample method.
An exit poll is taken of every tenth voter.
systematic
400
What is the range?
the difference between the highest and lowest value
400
Label the box and whisker plot.
smallest value
largest value
median
Q1 and Q3

400
What is the correlation of the plot?

positive
500
Identify the sample method.
Fifteen classes are randomly chosen. Ten students are chosen from each class.
stratified
500
Find the mean, median, mode and range of this set of data. 15, 10, 12, 10, 13, 13, 13, 10, 3
Mean: 11
Median: 12
Mode: 10 and 13
Range: 12
500
About how many sales happened when it was 22 degrees?
about $500