A ______________ shows data using bars.
Bar Graph
Make a tally chart for the following data.
Favorite Jellybean Flavors
Cherry - 17
Pineapple - 5
Licorice - 6
Grape - 3
Apple - 10

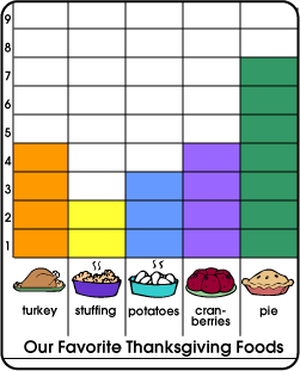
Turkey - 4
Stuffing - 2
Potatoes - 3
Cranberries - 4
Pie - 7

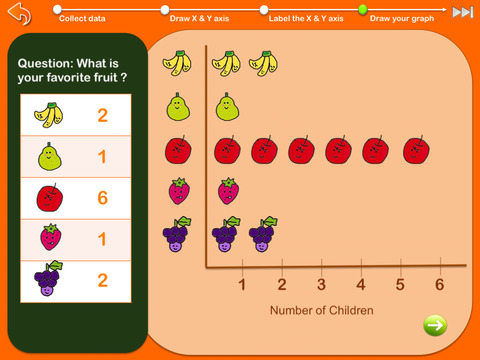
Make a picture graph with the following data of our pets.
Bird - 2
Fish - 3
Dog - 5
Cat - 3
Turtle - 1

Make a tally chart for the following data.
Pizza - 11
Burger - 9
Pasta - 10
Hot Dog - 5

A ______________ shows data using pictures.
Picture Graph

What is the least popular flavor?
Grape

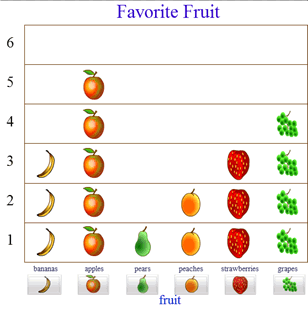
What is the most popular fruit?
Strawberries

Do more people have cats or birds as pets?
Cats

What kind of graph did they use to show their data?
They used a picture graph.
There are different pictures being used to represent the data.
A chart that shows a mark for each vote in a survey.
Tally Chart

Do more students like elephants or cats?
Cats

How many students like the color yellow?
9

How many people were surveyed?
3 + 2 + 5 = 10
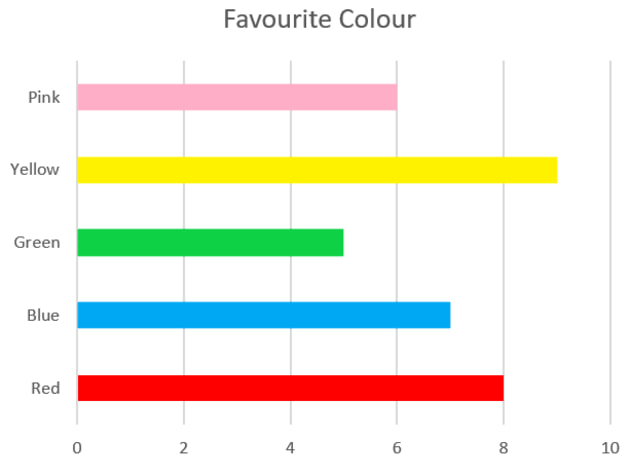
Make a bar graph of students' favorite colors.
Red- 9
Green - 5
Yellow - 8
Blue - 5
Purple - 4

Numbers or pictures collected that show information.
Data

How many more students like dogs than bears?
9 - 2 = 7

How many more trains did we see than trucks?
9 - 6 = 3

How many fewer people chose peaches than apples?
5 - 2 = 3

1. 4
2. Oranges
3. Bananas
4. 2
5. 3+2= 5
6. 6+4= 10
Collecting data by asking people the same question.
Survey
How many students prefer Coke?
19

Which sport got more than 6 votes?
Soccer

1. Orange - 6 Strawberry - 8
Apple - 7 Pear - 7
2. They have the same amount.
3. Strawberries
4. 6 + 8 + 7 +7 = 28
Make a tally chart and bar graph for the following data.
Bee - 6
Ladybug - 3
Butterfly - 4
Fly - 7
