Centers
Variance
Box and Whisker
Histograms
Two-Way Tables
Random
100
Determine the median of the set of data:
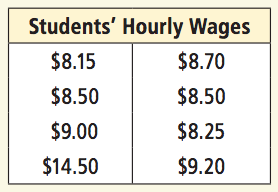
$8.60
100
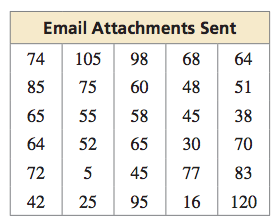
30 employees shared how many attachments they received in emails last week. Determine the range of the set of data.
115
100
Determine the five number summary of the data represented in the box and whisker plot.
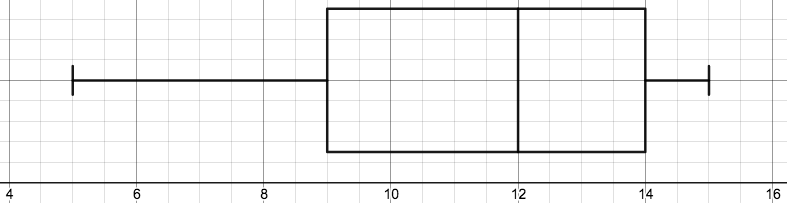
{5, 9, 12, 14, 15}
100
Describe the shape of the distribution of data shown in the histogram.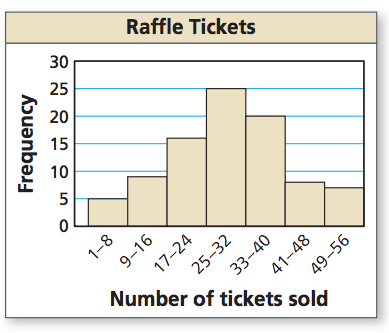
The data is symmetrical.
100
How many juniors were surveyed?
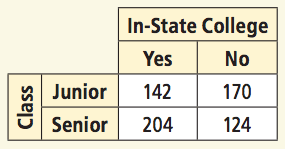
312 juniors
100
On average, how many teeth can a shark grow in a lifetime?
50,000
200
Determine the mean of the following set of data.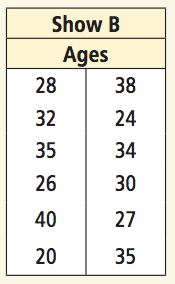
30.75
200
Determine the interquartile range for the set of data shown in the box and whisker plot.
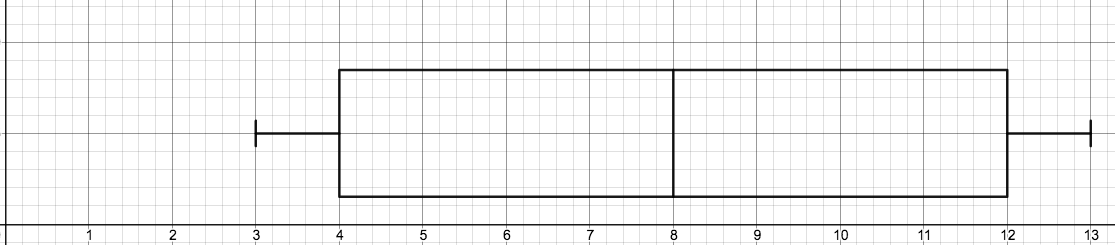
8
200
Determine the five number summary of the set of values:
30, 27, 32, 25, 12, 22, 20, 29, 35
{12, 21, 27, 31, 35}
200
How many people are represented in this histogram?
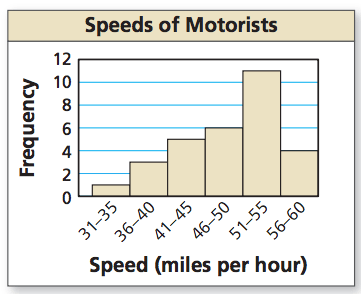
30 people
200
Which age group had the most participants in the survey?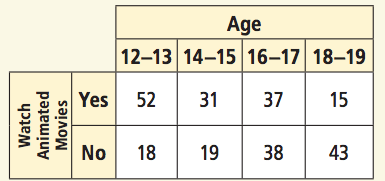
Age 16-17
200
On average, how many hairs do you have on your head?
100,000
300
If each student's current salary (below) was increased by $0.50, what would be the mean of the new salaries?
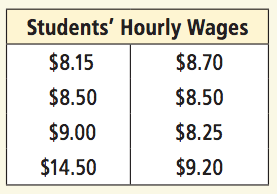
$9.85
300
Determine the five-number summary for the set of data.
24, 30, 30, 22, 25, 22, 18, 25, 28, 30, 25, 27
{18, 23, 25, 29, 30}
300
Create a box and whisker plot for the set of values:
−18, 0, 7, −8, −12, 15, 21, 0, 1, −3
{-18, -8, 0, 7, 21}

300
Which bin in the histogram contains the median?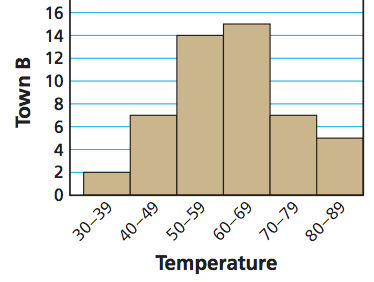
60-69
300
What percent of the people surveyed have a dog?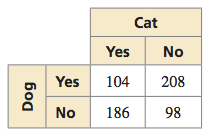
Abot 52% (312/596)
300
What % of the world is left handed?
11%
400
Which measure of central tendency is the best representation of the data in the histogram, and why?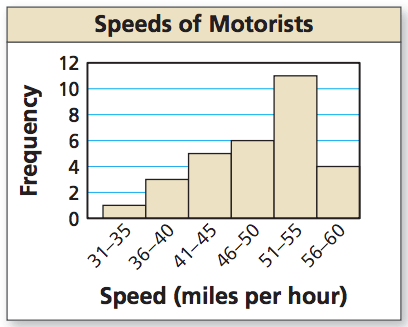
Median. Because the data is skewed left, with a larger amount of larger values, the median would be the best measure of center.
400
What is the range of the set of values below, if the mean is 7?
8, 2, 3, 4, 8, 10, 9, x
10 (12-2)
400
Create a box and whisker plot of the following set of data:
104, 75, 125, 90, 104, 320, 170, 134
{75, 93.5, 114.5, 161, 320}

400
These are the following wait times at a restaurant. Create a histogram with 5 bins, the first being 0-9. 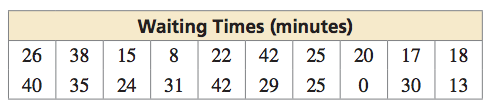
Check for equal width in bins, correct bin labels, frequency axis marked correctly.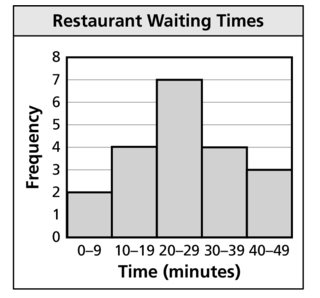
400
Students were surveyed to determine what type of bread and meat they'd like for their field trip lunch sandwich. What percent of turkey sandwiches were on wheat bread?
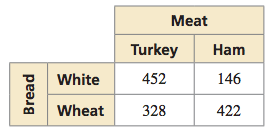
About 42% (328/780)
400
Which of these cities does not actually exist?
Why, Whynot, Because, Hospital, Normal, Surprise, Worms
Because
500
Determine a set of 10 values that has a mean which is twice its median.
Answers may vary. Ex:
10, 10, 10 ,10, 10, 10, 10, 20, 50, 60
500
Determine the standard deviation for the following set of numbers:
35, 52, 32, 35, 25, 29
About 14.1
500
Create a box and whisker plot given the data in the stem and leaf plot below.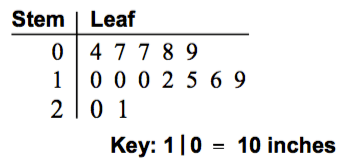
{4, 8, 10, 16, 21}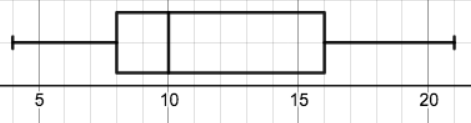
500
The table shows the last gas purchases at the pump.
Display the data in a histogram using six intervals beginning with 10–24.
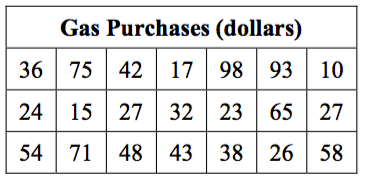
Check for equal bin intervals, correct bin heights, and frequency axis correctly set up.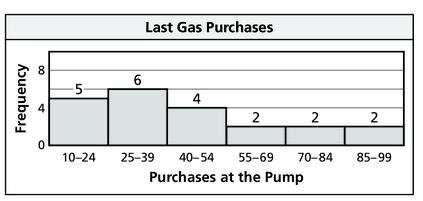
500
According to the two-way table, what percent of students who have never traveled on an airplane are sophomores?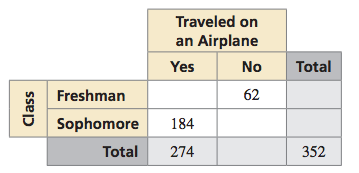
About 20.5% (16/78)
500
How many tiles are in this classroom?
628