Box Plots
Mean, Median and Mode
Solving Equations
Grab Bag!
Random Trivia
100
What is the median of this box plot?
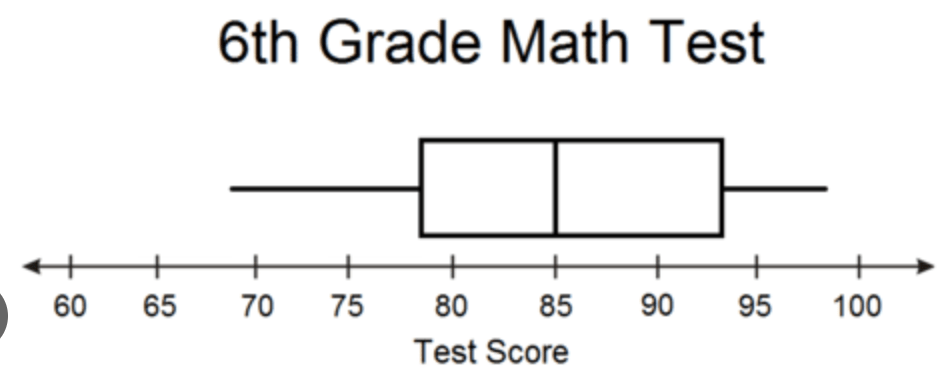
85
100
What is the Median of this list?
1, 3, 5, 7, 9
5
100
3n = 15
n = 5
100
Mr. LeMoyne grades 10 tests every 2 hours. Ms. Boucher grades 8 tests every 3 hours. Who grades faster?
Mr. LeMoyne
100
The last day of school is May 21. How many days of school are left, not including today?
28
200

What is the range of this box plot?
13 - 7 = 6
200
What is the Mean of this list?
1, 2, 2, 4, 4, 6, 8, 10
4.625
200
x + 10 = 25
x = 15
200
Solve
3(5-4) + 32
3(1) + 9 = 3 + 9 = 12
200
How many states are there in the United States of America?
50
300
What is the Third Quartile of this box plot?
9.5
300
What is the mode of this list?
1, 1, 3, 3, 3, 5, 8, 10, 12
3
300
k - 4 = 18
k = 22
300
1 1/4 div7/8
40/28
300
Name or describe any part of the water cycle
Precipitation (rain), condensation, evaporation
400

What percent of the data in this box plot is between 8 and 14?
50
400
What is the median of this list?
1, 6, 2, 3, 8, 12, 4, 5, 5, 4
4.5
400
x/5 = 5
x = 25
400
7.32 div1.2
6.1
400
Name any soccer team still in the Champions League
Real Madrid, Bayern Munich, Paris Saint-Germain (PSG), Liverpool, Barcelona, Atletico Madrid, Arsenal, and Sporting CP
500
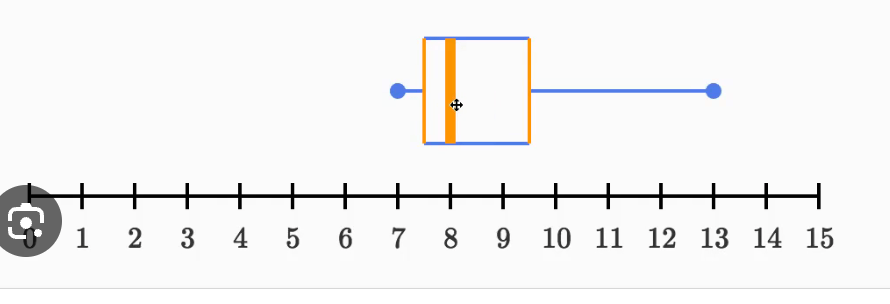
Mr. LeMoyne says "50% of the data in this box plot is greater than 9.5" Is he correct? Why or why not?
He is not correct. 25% of the data in this box plot is greater than 9.5, not 50%.
500
Find the mean and median of this list.
1, 6, 8, 4, 3, 1, 3, 55
Which is a better measure of central tendency here? Why?
Mean: 9.75
Median: 3.5
The median is a better measure, because it better represents an average number in this list.
500
x/8 = 4.3
x = 33.4
500
Which is bigger, |-6| or 1.28 + 3.56
1.28 + 3.56 = 4.84
|-6| = 6
500
How many people live in Lincoln?
~300,000