equations
conditions
calculator functions
random
definitions
100
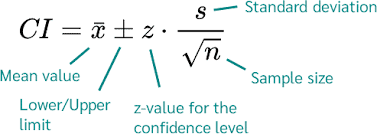
Why is this equation important?
This equation is used to find the confidence interval. It is useful to determine a range in which the true value would most likely be.
100
What is the first step that must be completed when meeting conditions?
Create a scatter plot of x and y to show a linear relationship
100
How do you add x and y values to the table?
Go to stats
-Click edit
-Make sure that there are no numbers on the table before entering values
100
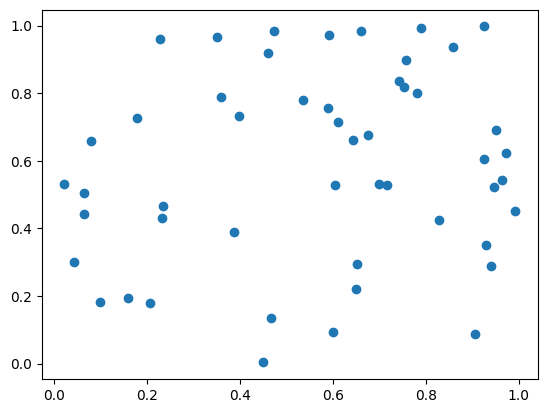 What is this called?
Scatter Plot
100
What is another name for a bell curve

normal distribution
200
tcdf(lower bound,upper bound, degrees of freedom)=
What does this equation represent?
This equation represents the p-value. P-value is helpful to compare with the alpha level
200
What is the equation for the 10% condition
n<.1N
200
Where is the LSRL function on the calculator?
-Go to stats
-Calc
-click on LinReg(ax+b)
200

Is there a positive or negative relationship according to this graph?
negative
200
What is the definition of statistics
Statistics is the study of data
300
What is another formula to find the standard error of B?
s/sx( n-1)
n-1)
300
What is the third step while checking conditions?
Create a histogram of residuals to show no skewness or approximately normal.
300
How do you find the P-value on the calculator?
-Go second, vars
-Click on button 6, tcdf
300
Is this bell curve skewed?
Yes, it is skewed to the right
300
What is something that can be easily forgotten but important to conduct.
The Least Squares Regression Line
400
t= b/SEof b
What are we trying to find with this equation?
This finds your t-score used when running a hypothesis test for slope.
400
What is equal standard deviation?
It is when you create a residual scatter plot of x and residuals. There should be no pattern present.
400
How do you find the t-test for slope on a calculator?
-Go to stats under tests
-Go to F: LinRegTTest
-Plug in your x and y lists
-frequency and regeq should remain the same
-B&P does not = 0<0>0, click the one that matches the problem
-Click Enter to find results
400
Would this be considered a normally distributed bell curve?
yes
400
Why is a confidence interval important?
An interval in which the true value is most likely to lie within.
500
T- star = inT(confidence interval to the right, and the degrees of freedom)
T-star is important because it helps determine the population means.
500
Must there be randomness for the conditions to be met?
yes
500
How do you use the calculator to find the T-interval for the slope?
-Go to stats
-Got to calc, and find G: LinREgTInt
-Plug in your X list so that it is L1
-Plug in your List for L2
-Do not change reqeq or frequency
-Put confidence level in decimal
-Click Enter to find the results
500
What is this graph called?
This is called a histogram.
500
What are some things that are important to include in a good conclusion?
-If we reject or fail to reject the claim
-How the P-value compares to the alpha level
- If there is a confidence level, include it in the conclusion
- Make to include context from the problem