Name it
percents, mode, median
Terms
Graph questions
Scatterplots and B/W Plots
100
Name the kind of graph
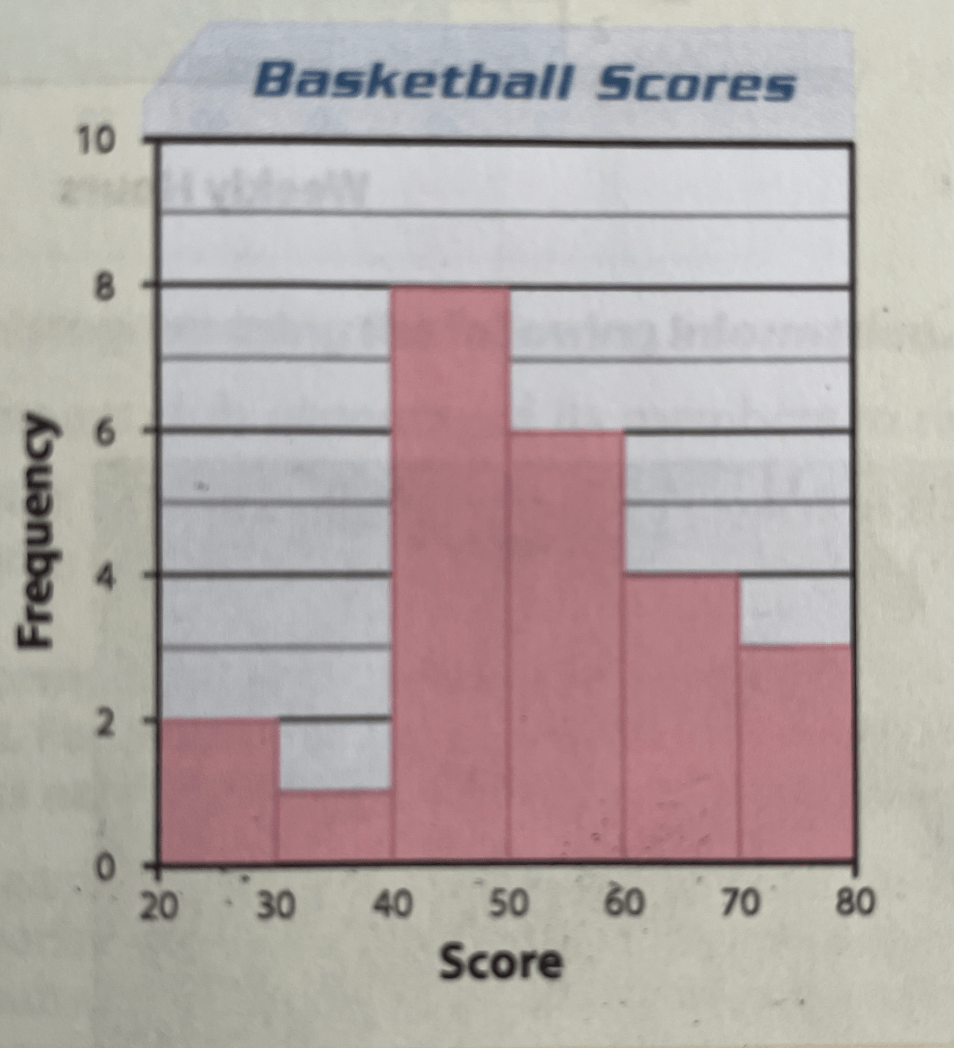
Histogram
100
If 30% of the zoo's animals are reptiles, and there are 88 reptiles are the zoo, how many total animals does the zoo have?
30% of what = 88
.3x = 88
293
100
What is the difference between the largest and smallest data values?
Range
100
How much did Vanessa budget for entertainment?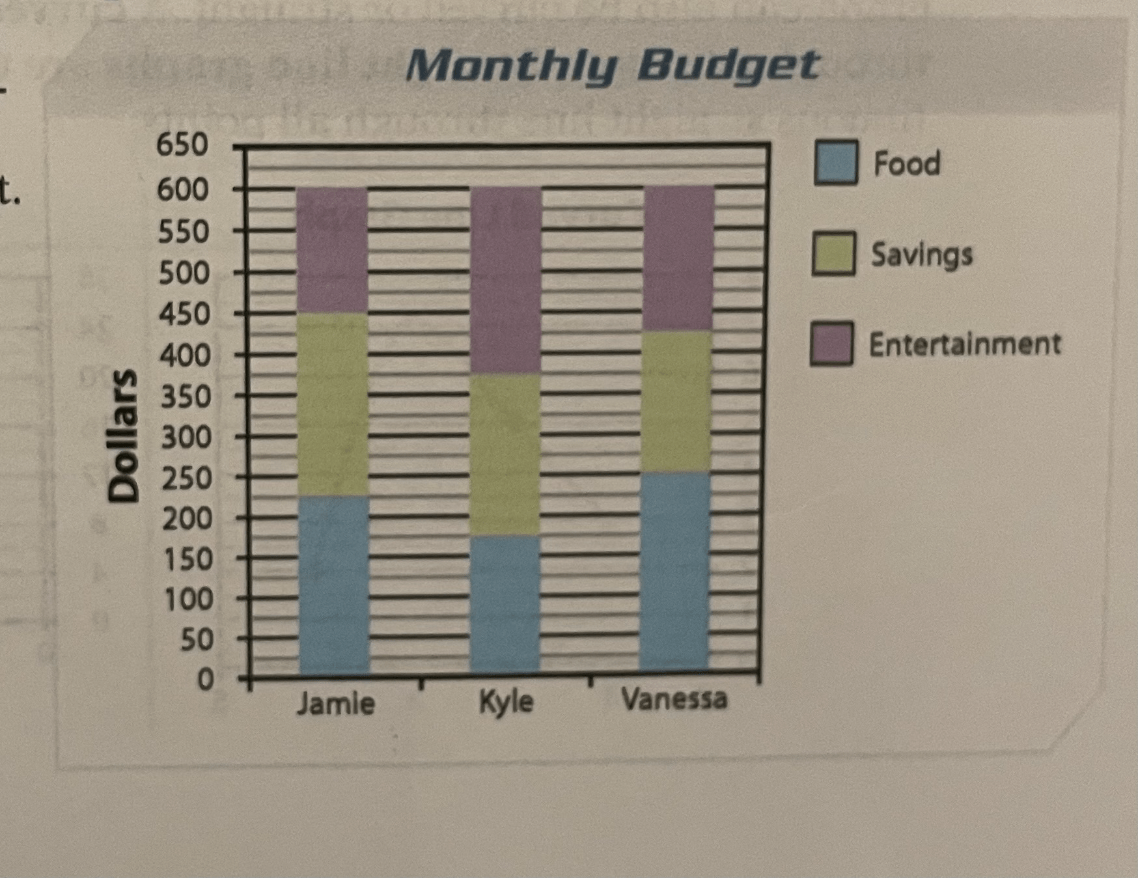
$175
100

1. Is this a positive or negative association?
2. It is linear or nonlinear?
negative
linear
200
Name the graph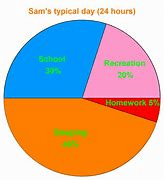
circle graph
200
The state has 20 government buildings. Four of those are post offices. What percent are post offices?
4 = wp of 20
4 = 20x
20%
200
DAILY DOUBLE (a review question):
How much do you want to wager?
In Algebra, points and lines are graphed on the ____________________ ______________.
200
Linear or nonlinear?? Why?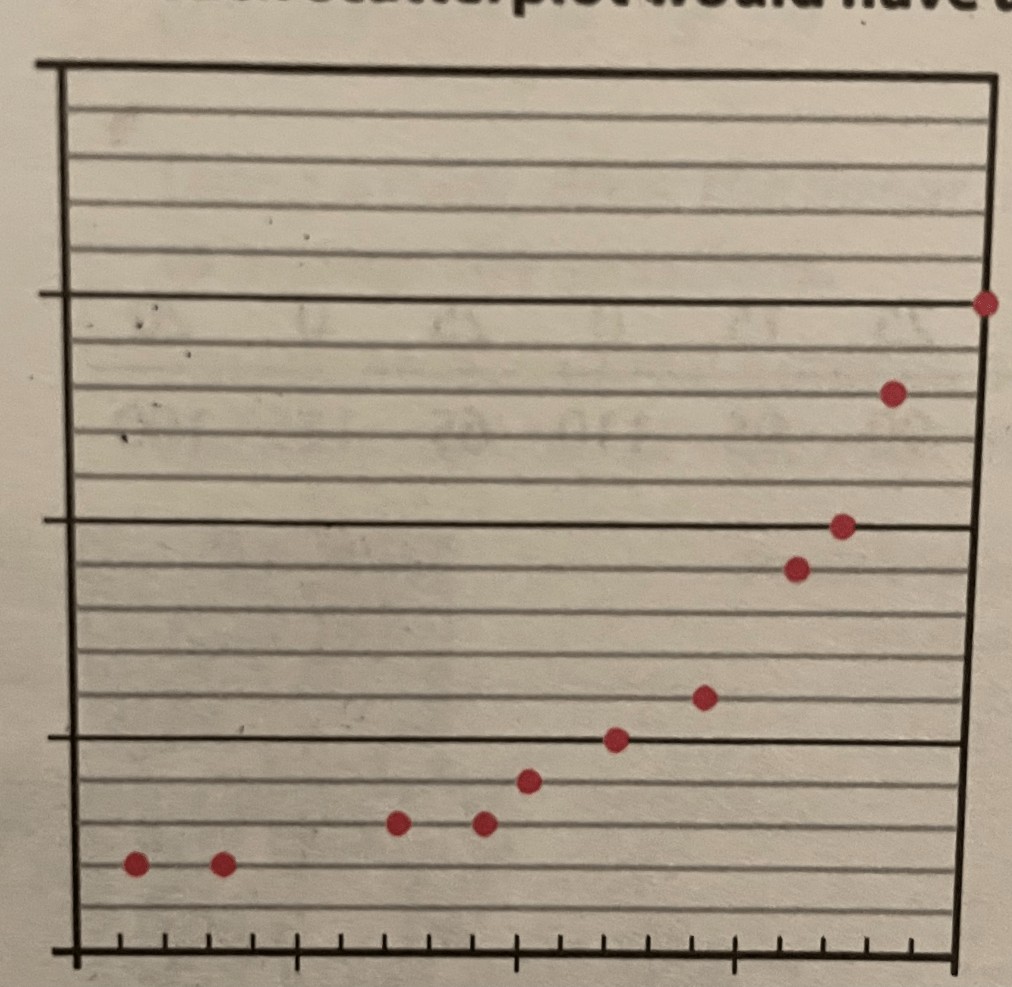
Nonlinear, because the trend line wouldn't be straight.
200
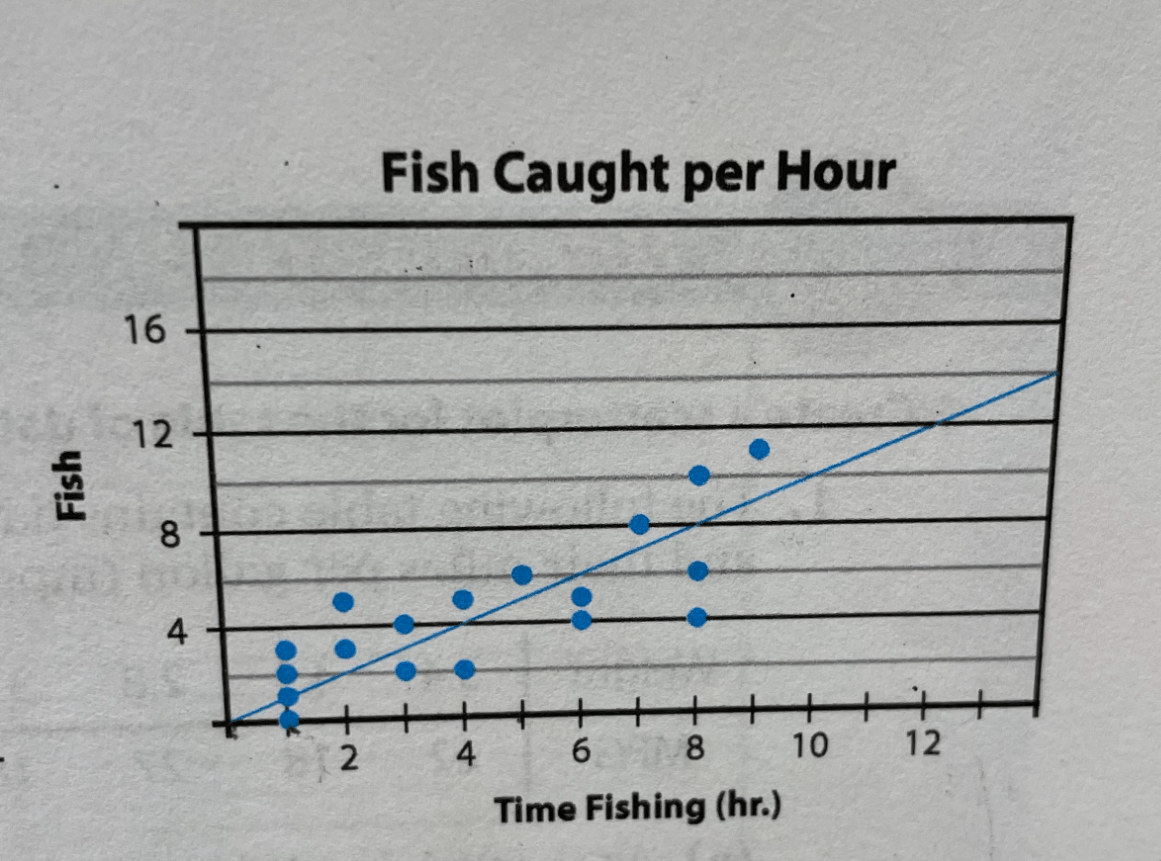
1. If someone caught 6 fish, how long do you think they would have been fishing?
2. If someone fished for 3 hours, how many fish would he catch (approximately)
1. 5-6 hours
2. 3 fish
300
Daily double: how much do you want to wager?
300
DAILY DOUBLE (a review problem):
How much do you want to wager?
25% of what number is 200?
300
In a scatterplot, what is the name of the line that best approximates the pattern of data?
Trend Line
300
DAILY DOUBLE (how much do you want to wager?)
in a Box and Whisker plot, what is the name for the median of the upper half of the data values?
300
write the 5 number summary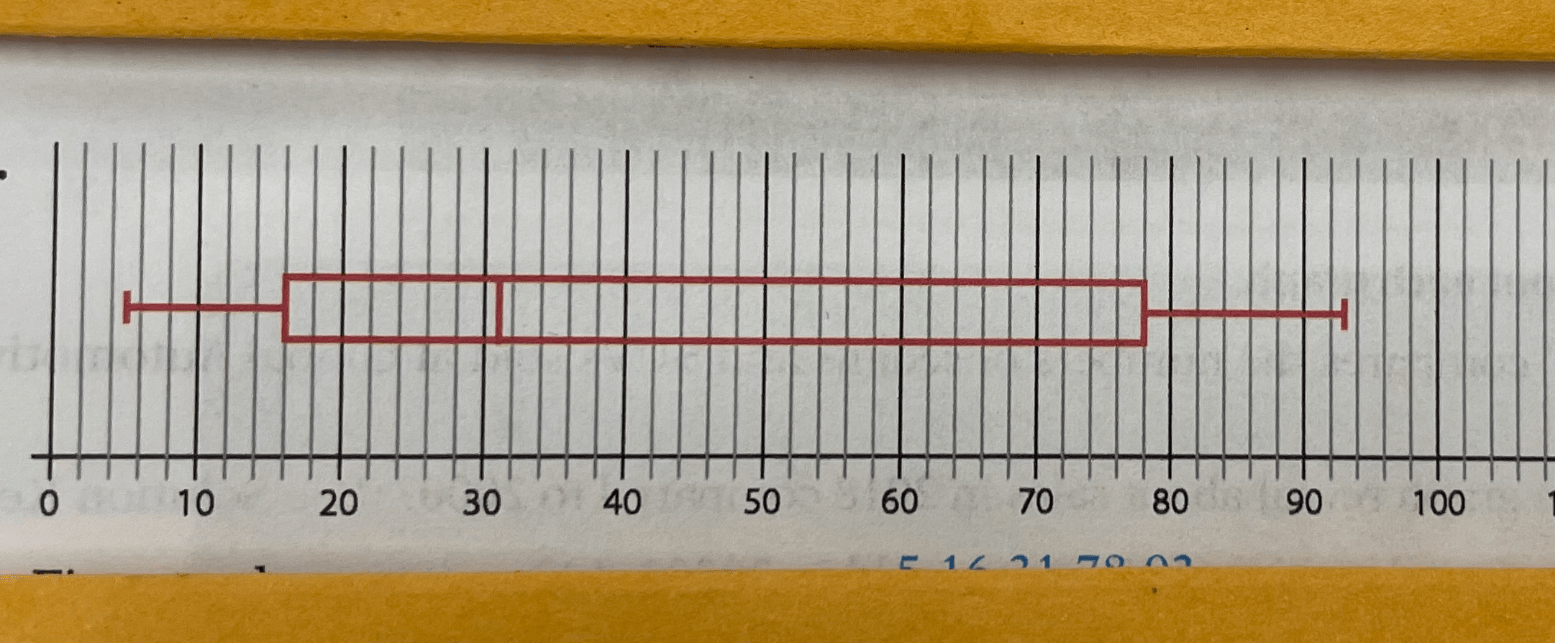
5 16, 31, 78, 93
400
Name it
Box-and-whisker plot
400
Find the mode and median.
39, 13, 16, 22, 25, 17, 28, 34, 50, 26, 55
Mode none
Median 26
400
Scatterplot points that are grouped/huddled together
clusters
400
Which type of graph is best to show changes in value over time?
Line graph
400
What is the value for Q1 and Q3?
16 and 78
500
Name it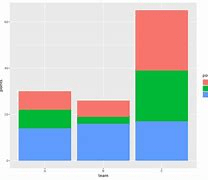
stacked bar graph
500
DAILY DOUBLE (review problem)
How much do you want to wager?
Solve:
8x - 7 = 23 - 2x
500
The type of graph that helps visualize the relationship between 2 variables
Scatterplot
500
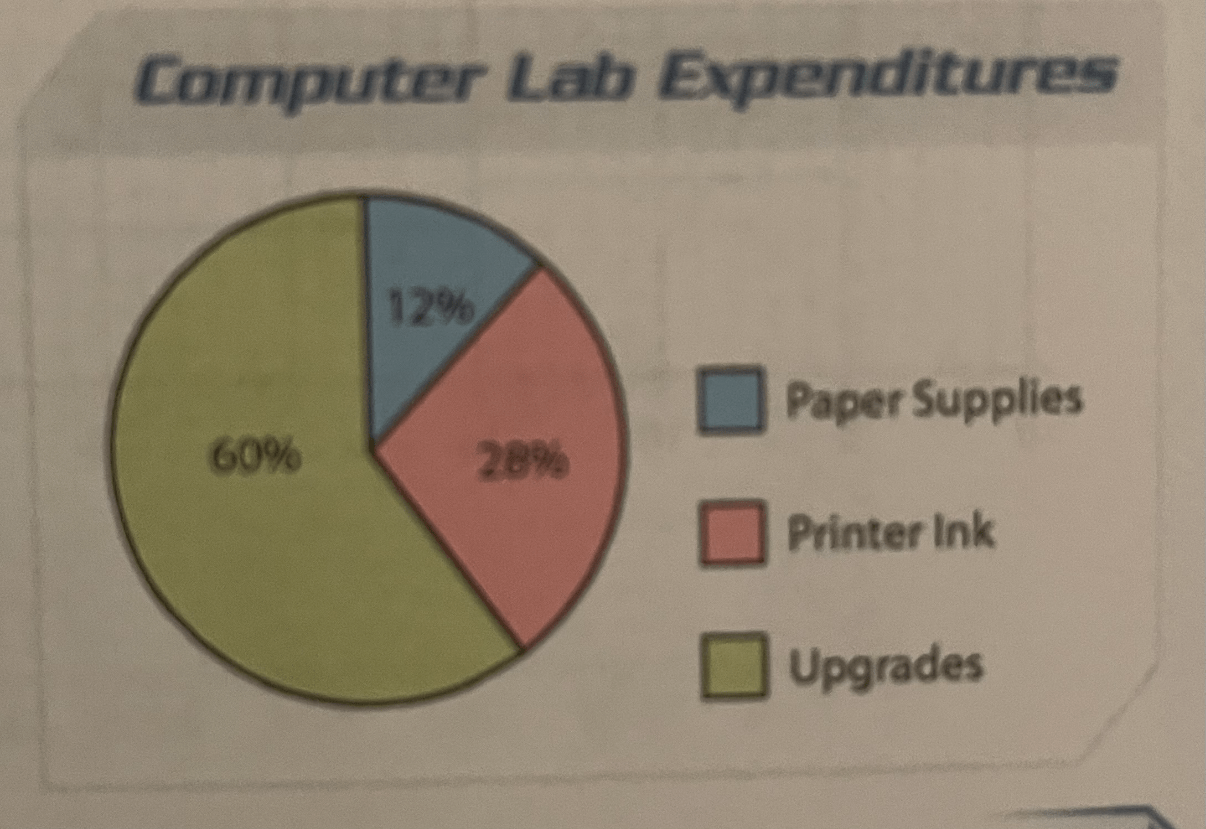
The computer lab spent a total of $1,760 on supplies. How much was spent on printer ink?
.28 x 1760 = $492.80
500
1. What is the max time that she spent on homework?
2. Does homework or leisure have the greater range?
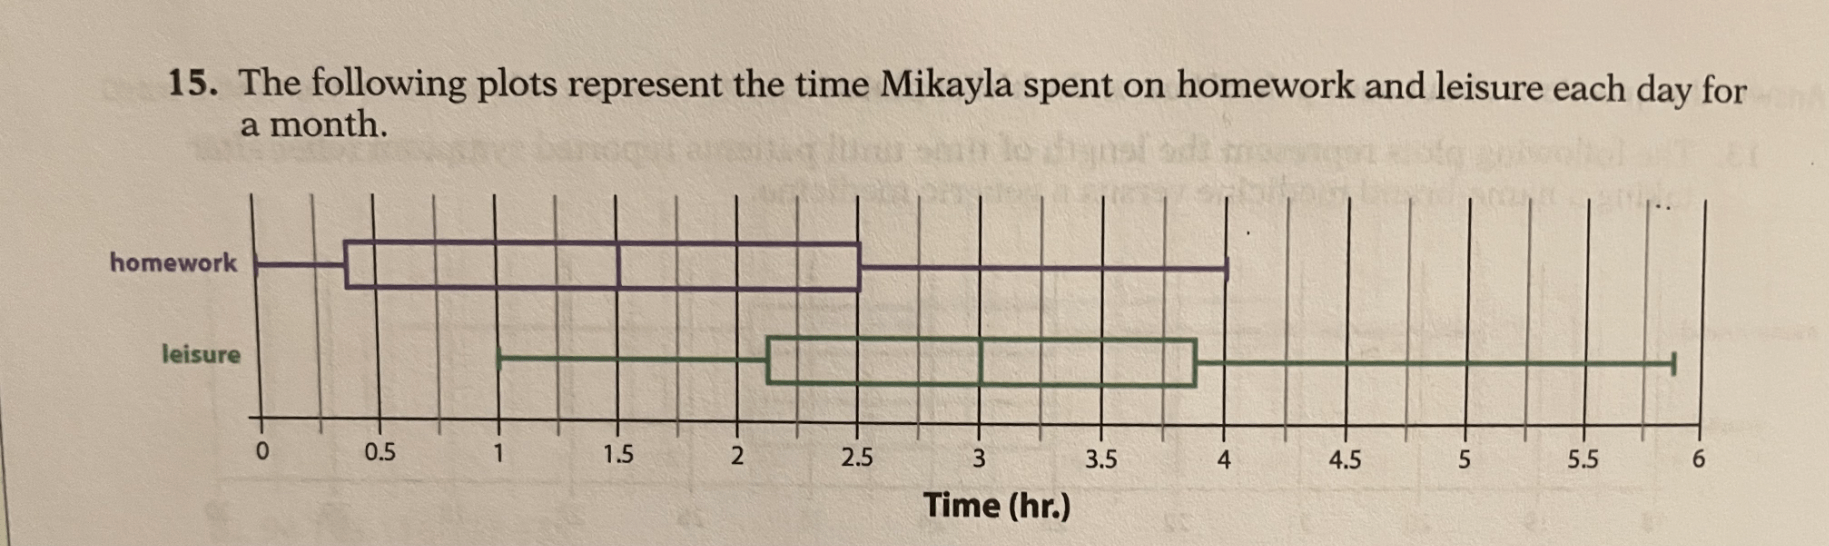
4 hours
homework (4) and leisure (4.75)