Graphs
Measures of Center
Measures of Variability
Boxplots
Calculate
100
This type of graph is known as 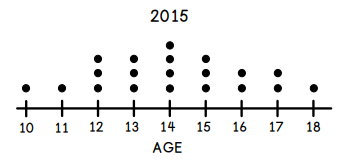
What is a dot plot?
100
This measure of center is also known as the average.
What is mean?
100
The range is found by subtracting these two values.
What are max and min?
100
The median number of Caramel Mocha Spice drinks sold in a day. 
What is 10?
100
This number is the mode for this data set
{ 1, 5, 8, 3, 6, 7, 2, 5, 6, 7, 5}
What is 5?
200
The missing interval for this histogram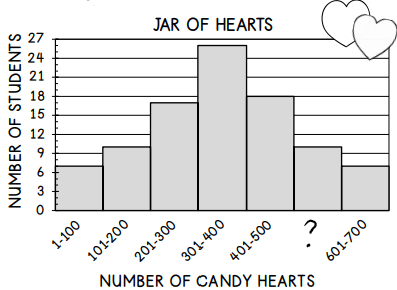
What is 501-600
200
Some refer to this measure as the "middle number."
What is median?
200
The interquartile range is found by subtracting these two numbers.
What are Q3 and Q1?
200
A five number summary is composed of these five points.
What are Min, Q1, Q2(Median), Q3, and Max?
200
This is the Median for this dataset?
1, 10, 8, 2, 3, 3, 6, 7, 1
What is 3 ?
300
The interquartile range is clearly displayed on this graph.
What is a boxplot?
300
The value that occurs the most in a data set.
What is mode?
300
Another way of saying Lower Quartile, Median, & Upper Quartile.
What Quartile 1, Quartile 2, & Quartile 3?
300
Data values that are outside the vicinity (very different) of the rest of the data
What is an outlier
300
This is the mean of this dataset?
{1,5,7,6,2,7,3, 1}
What is 4?
400
This type of graph displays information using bins or intervals.
What is a histogram?
400
Name the three measures of center.
What is mean, median, and mode?
400
A way in which a box plot would different if the data was spread out versus close together.
What is the Box Plot would look longer or shorter?
400
Boxplots are incomplete without this feature below it.
What is a number line?
400
This number is the IQR for the dataset
{1,2,4,6,8,9,10,18}
What is 6.5?
500
FREE
FREE
500
An outlier can have a huge effect on this measure.
What is mean.
500
Calculate the Interquartile Range of the data:
4, 6, 4, 2, 9, 1, 12, 7
What is 5?
500
The shape of distribution of Mint Mocha Chip sales graph. 
What is Skewed Left?
500
The number of gigs a family uses on their cell phone data plan for 12 months are as follows:
7, 5, 10, 12, 9, 7, 11, 31, 12, 6, 8, 9
Describe how the outlier affects the mean of the data set.
What is the outlier pulls the mean up from what it would have otherwise been?
600
The shape of this graph. 
What is skewed right?
600
Which interval most likely contains the mode for inches of rainfall?
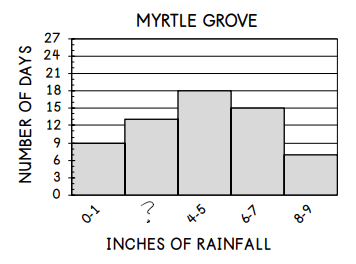
What is 4-5 inches
600
This measure describes the middle half of data.
What is interquartile range.
600
The flavor latte which has more a consistent number of sales.
What is Caramel Mocha Spice?
600
The percentage of employees who have worked between 4-5 years. 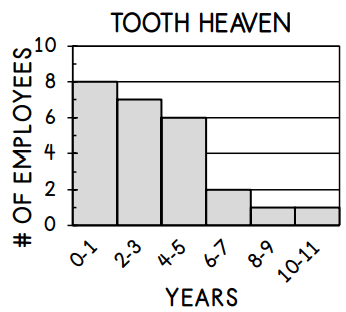
What is 24%?
1000
The interval the median is located in. 
What is 2-3 years?
1000
The student with the symmetric data. 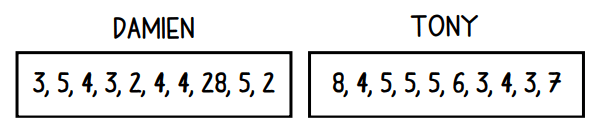
What is Tony?
1000
The interquartile range of this graph.
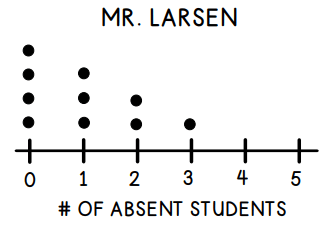
What is 2?
1000
The difference between the interquartile range of Mint Mocha Chip ad Carmel Mocha Spice.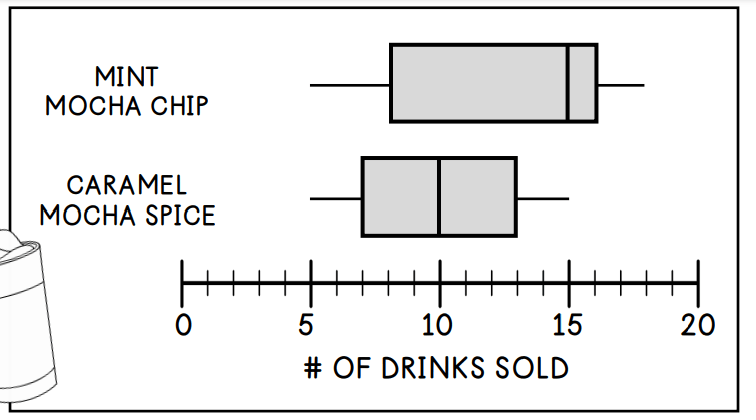
What is 2?
1000
The Mean Absolute Deviation of this Data Set.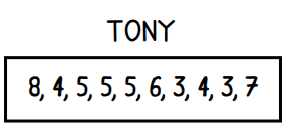
What is 1.2?