Choose
Check
Calculate
Conclude
Random
100
We know what the manufacturer claims the real color distribution of skittles to be, and we want to see if they are lying. We purchase a large bag of skittles to help us test this claim.
We would use a __________.
Chi-Square GOF Test
100
To conduct a Chi-Square test, we must have this type of data.
Categorical
100
We calculate the expected counts in a Chi-Square GOF Test by _________.
multiplying the sample size by the given distribution's proportion
100
A Chi-Square statistic of 17.87 and a df of 6 would result in what p-value
p-value of ~0.006565
100
What is the shape of any Chi-Square distribution?
Skewed Right
200
We want to know if, in general, Summit and Livingston students get the same scores on their AP Statistics exams. We take separate samples from each building and compare the number who earn a 5, 4, 3, 2, or 1 on their test. We would use a __________.
Chi-Square Test for Homogeneity
200
Every expected count must have a value of at least ___.
5
200
__________ determines the number of Degrees of Freedom for a Chi-Square GOF Test.
(# of categories) - 1
200
The X^2 value for our test was "a". The p-value for our test is 0.0119. Interpret the p-value.
Assuming the null is true, the probability of getting a X^2 value of "a" or more due to chance alone is 0.0119.
200
The larger the Chi-Square statistic, the __________ the p-value.
Smaller
300
A school's principal wants to know if students spend the same amount of time on homework each night of the week. She asks a random sample of 50 students to keep track of their homework time.
Day: Sun. Mon. Tues. Wed. Thur. Fri. Sat.
Time: 130. 108. 115. 104. 99. 37. 62.
Is the X^2 GOF Test appropriate? Why or why not?
No. Time spent doing homework is a quantitative variable. X^2 is only used for categorical data.
300
The expected count for 6th Graders with sports as their goals
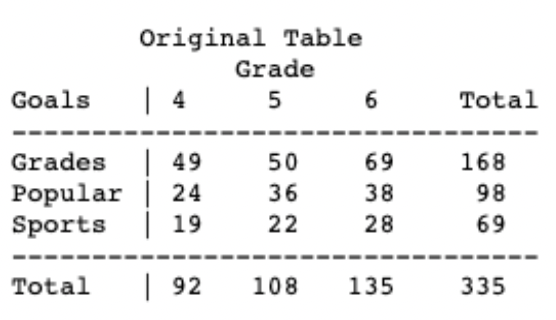
(135*69)/335=27.81
300
__________ determines the number of Degrees of Freedom for a Chi-Square Test for Association/Independence.
(rows-1)*(columns-1)
300
We are testing whether or not the city of Waubun has the same age distribution as that of Ogema. Our Chi-Square value is 17.8, and our p-value is 0.003. Do we reject or fail to reject Ho?
Since our p-value (0.003) is less than our significance level of alpha=0.05, we must reject the null hypothesis. We do have sufficient evidence to suggest that there IS a difference between the distribution of age among Waubun residents and the distribution of age among Ogema residents.
300
Choose the chi square test to use:
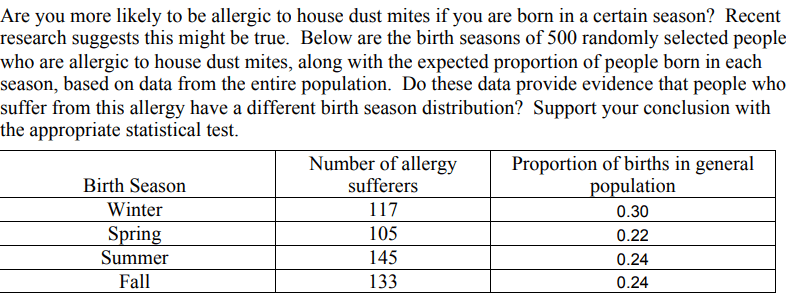
Chi-Square Goodnees of Fit Test
400
We want to determine whether or not musical preference among high school students has any influence on these students' preference of social media sites.
We would use a __________
Chi-Square Test for Association/Independence
400
We check this condition to assure that our sampling distribution follows the chi-squared family of curves.
What is all expected counts > 5.
400
The formula for calculating the expected counts of a Chi-Square Test for Homogeneity is __________.
[(Row Total)*(Column Total)]/(Table Total)
400
We ran a Chi-Square test to determine whether males or females traditionally score higher on their AP Statistics exams. We got a Chi-Square statistic of 3.72 and a p-value of 0.146. Our conclusion (based on a significance level of alpha=0.05) is __________.
Since our p-value (0.146) is greater than our significance level of alpha=0.05, we must fail to reject the null hypothesis. We do NOT have sufficient evidence to suggest that there is a difference between the distribution of AP Statistics exam scores for males and the distribution of AP Statistics exam scores for females.
400
I take ONE sample and ask TWO categorical questions. Which chi-square test(s) can I run based on this information alone?
Chi-Square test for Association or Independence
500
We want to see if hand dominance (being right-handed or left-handed) and eye color are genetically linked.
The hypotheses for this test would be __________.
Ho: There is no association between hand dominance and eye color.
Ha: There is an association between hand dominance and eye color.
500
The expected count for Women with Cats

(438*473)/962 = 215.3575884?
500
The formula for calculating a Chi-Square Test Statistic is __________.
500
We want to determine whether or not musical preference among high school students has any influence on these students' preference of social media sites. The Chi-Square statistic was 18.7 and the p-value was 0.043. A complete conclusion (based on a significance level of alpha=0.05) is __________.
Since our p-value (0.043) is less than our significance level of alpha=0.05, we must reject the null hypothesis. We have sufficient evidence to conclude that there IS an association between musical preference and social media site preference.
500
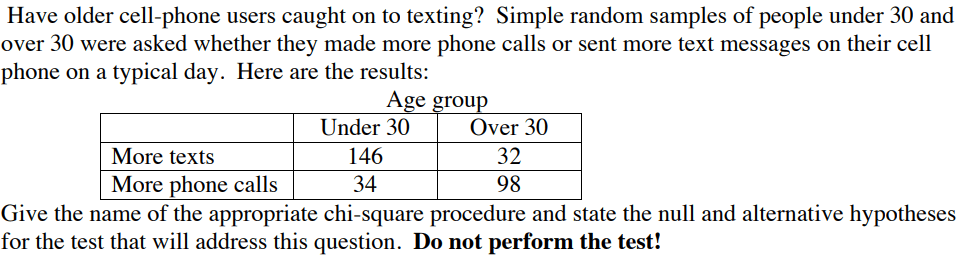
Chi-Square Test for Homogeneity
H0:The distribution of texts and phone calls for the two age group populations are the same.
Ha:The distributions of texts and phone calls for the two age group populations are different.