Circle Properties
Circle Graph Problems
Graphs
Construct Circle Graphs
% of a Number
100
What total percent does a circle graph equal?
What is 100%?
100

These two teams account for 50% of the favorite picks.
Who are the Bears and Raiders?
100
What is the horizontal axis of a bar graph called?
What is the X-axis.
100
Draw/show 25% of a circle graph.
What is _______ ?
100
What is 10% of 360?
What is 36?
200
The distance from one end of a circle to the opposite end, through the center.
What is Diameter?
200
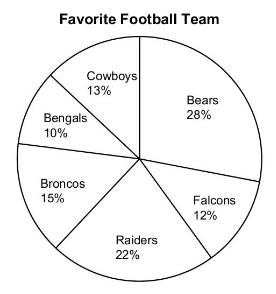
If there are 250 people who picked their favorite team, how many chose the Falcons?
What is 30 people?
200
What is the vertical axis on a bar graph called?
What is the Y-axis?
200
Draw/show 50% on a circle graph.
What is ___________?
200
What is 25% of 360?
What is 90?
300
The distance from the edge of a circle to its center?
What is Radius?
300
If Ms. Martinez' class has 55 students and 20% of the students have black hair, how many students have black hair?
What is 11 students?
300
A graph that consists of data points plotted as dots on a graph with a number line is called a __________.
What is a dot plot?
300
Draw/show 12.5% on a circle graph.
What is _________?
300
What is 45% of 360?
What is 162?
400
The distance around a circle?
What is Circumference?
400
There was a total of 427 injuries reported at a fitness center last year. 41% were from free weights, 32% were from falling off treadmill, 24% minor bruises, and 3% from other. About how many people fell off the treadmill?
What is 137?
400
A diagram where the data is represented by the height or length of lines or rectangles of equal width with an x and y axis.
What is a bar graph?
400
There was a total of 427 injuries reported at a fitness center last year. 41% were from free weights, 32% were from falling off treadmill, 24% minor bruises, and 3% from other.
Construct a circle graph for the data.
What is _________?
400
What is 0.5% of 360?
What is 1.8?
500
The ratio of the Circumference of a circle to it's diameter?
What is pi?
500
There are 80 cars in the YWLA parking lot. 15% belong to juniors; 25% belong to seniors; 20% belong to visitors; and 40% belong to the faculty. How many more seniors parked their car in the parking lot than visitors?
What is 4?
500
A way of representing statistical data on a plot in which a rectangle is drawn to represent the second and third quartiles, usually with a vertical line inside to indicate the median value. The lower and upper quartiles are shown as horizontal lines either side of the rectangle.
What is a box and whisker plot?
500
There are 80 cars in the YWLA parking lot. 15% belong to juniors; 25% belong to seniors; 20% belong to visitors; and 40% belong to the faculty. Constuct a circle graph for the data.
What is _________?
500
What is 1/8 0f 360?
What is 45?