Sample vs. Population
Circle Graph Problems
Graphs
From the Guide
% of a Number
100
A beverage company wanted to see if people in the United States liked their new logo.
Which choice best represents a population?
A. A selection of logo artists.
B. Every person in the United States.
C. A selection of shoppers from different states.
D. 3,800 children age 5 - 15
B
100

These two teams account for 50% of the favorite picks.
Who are the Bears and Raiders?
100
What is the horizontal axis of a bar graph called?
What is the X-axis.
100
Question 1
B. Survey 20 students from each grade level, chosen randomly.
100
What is 10% of 360?
What is 36?
200
Before a nation wide election, a polling place was trying to see who would win.
Which choice best represents a sample?
A. A selection of voters over age 50.
B. A selection of male voters.
C. A selection of voters of different ages.
D. All voters.
C
200
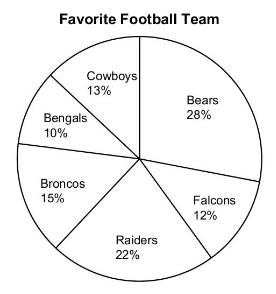
If there are 250 people who picked their favorite team, how many chose the Falcons?
What is 30 people?
200
What is the vertical axis on a bar graph called?
What is the Y-axis?
200
Question 3
B. $40
200
What is 25% of 360?
What is 90?
300
Teacher Marcos wants to know the average score of every student in his class. Determine whether the following data set is a population or a sample in the given context.
Population or Sample
10 randomly selected students from his class
Sample
300
If Ms. Martinez' class has 55 students and 20% of the students have black hair, how many students have black hair?
What is 11 students?
300
This type of graph shows numerical categories
Line plot
300
Question #5 data plot. What is the balance point?
3.95
300
What is 45% of 360?
What is 162?
400
Researcher Arthur wants to know the average age of every person in a city. Determine whether the following data set is a population or a sample in the given context.
Population or Sample
Every resident of a city
Population
400
There was a total of 427 injuries reported at a fitness center last year. 41% were from free weights, 32% were from falling off treadmill, 24% minor bruises, and 3% from other. About how many people fell off the treadmill?
What is 137?
400
This type of graph shows categorical data where the height of the bar shows how many belong in it
bar graph
400
Question #7
Graphs A and Graphs B
400
What is 0.5% of 360?
What is 1.8?
500
Pet food CEO Jody wants to know how many people in a city have a dog. Determine whether the following data set is a population or a sample in the given context.
Population or Sample
Every pedestrian that Jody sees in a day
Sample
500
There are 80 cars in the YWLA parking lot. 15% belong to juniors; 25% belong to seniors; 20% belong to visitors; and 40% belong to the faculty. How many more seniors parked their car in the parking lot than visitors?
What is 4?
500
Which graph is the best to use for this scenario.
A percentage of the school's population and their favorite hobbies.
Circle graph
500
Question #6
2
500
What is 1/8 0f 360?
What is 45?