Statistical Vocabulary
Data Display
Problems
100
This is the value occuring the most often
Mode
100
The length of each bar represents the quantity in question. The width of each bar has no significance.
Bar chart
100
Find the median based on the below graph
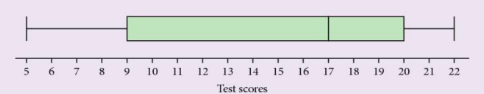
17
200
This is the middle value when all data is arranged in order of size.
Median
200
The information is displayed using sectors of a circle.
Pie Chart
200
Based on the below graph, find the lowest mark
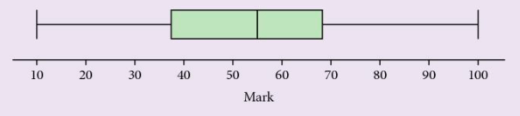
10
300
The difference between the largest and the smallest values in the data set
Range
300
Data can be displayed in groups using this diagram. We start by choosing a sensible way to group data. We also need to include a key, containing a sample piece of data, so that people know how to interpret our diagram.
Stem-and-leaf diagrams
300
Based on the below graph, find the mode

15.2
400
This is found by adding together all the values of the data and then dividing that total by the number of data values
Mean (average)
400
This way of displaying data can be drawn by joining the midpoints of the tops of the bars on a frequency chart.
Frequency polygons
400
Find the median for the below data set
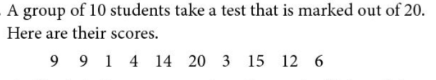
9
500
The correlation between two sets of data can be positive or negative and it can be strong or weak. We may see these correlation easily by using this graph
Scatter graphs
500
The frequency of the data is shown by the area of each bar. They resemble bar charts but are not to be confused with them: in bar charts the frequency is shown by the height of each bar. Sinice they have bars of varying widths, the height must be adjusted to correspond with the width of the bar.
Histograms
500
Find the interquartile range for the below data set

10