Classification of Data
Dot Plots & Stem-and-leaf Plots
Frequency Tables & Graphs
Range, Median, Mode & Mean
100
State whether a census or a sample is the most appropriate way to collect this data:
"Information on the shopping experience of people in the city."
Sample
100
The stem-and-leaf-plot represents the results achieved by students in a test:
0 | 6
1 | 2358
2 | 2446789
3| 014
What is the highest score in this test?
34
100
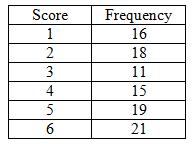
The frequency table shows the results of students favourite colours.
How many students didn't choose blue?

7
100
Find the range of the following data set:
74
200
Classify the following as Categorical or Numerical:
"A person's lucky number"
Numerical
200
The stem-and-leaf-plot represents the results achieved by students in a test:
0 | 6
1 | 2358
2 | 2446789
3| 014
Which score occurred the most number of times?
24
200
The frequency tables shows the temperatures for the past week.
What percentage of the week was over 23 degrees (round to the nearest percentage)?

57%
200
Find the median of the following data set:
22, 20, 22, 23, 23, 24, 25, 25, 21, 20, 20, 25
22.5
300
Classify the following as Discrete or Continuous
"The amount of water used in the past month."
Continuous
300
The stem-and-leaf-plot represents the results achieved by students in a test:
0 | 6
1 | 2358
2 | 2446789
3| 014
What is the difference between the highest and lowest scores?
28
300
The frequency table shows the scores of a test.
What is the class centre of 30-40?
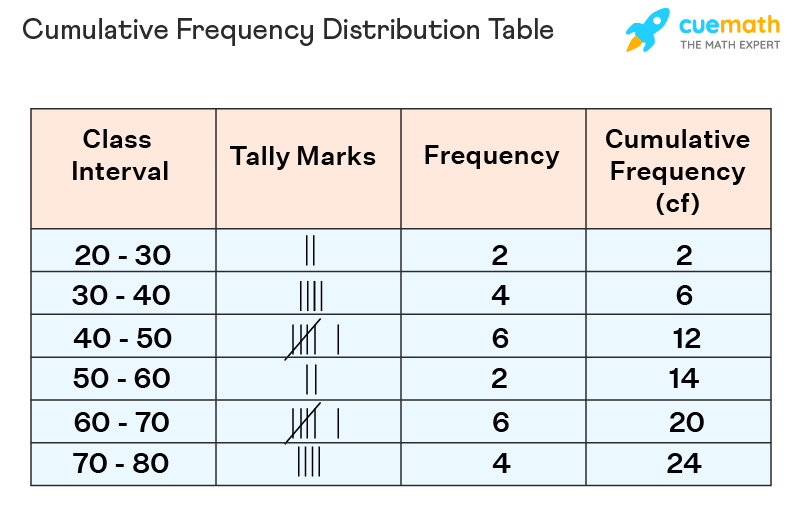
35
300
Find the mean of the following data set:
366/100 = 3.66
400
State whether the sample is random, stratified, systematic or self-selected:
"A police officer breathalyses every tenth person."
Systematic
400
The stem-and-leaf-plot represents the results achieved by students in a test:
0 | 6
1 | 2358
2 | 2446789
3| 014
How many students completed the test?
15
400
The frequency table shows the amount of bird species at a bird feeder.
In total, how many birds visited the bird feeder?
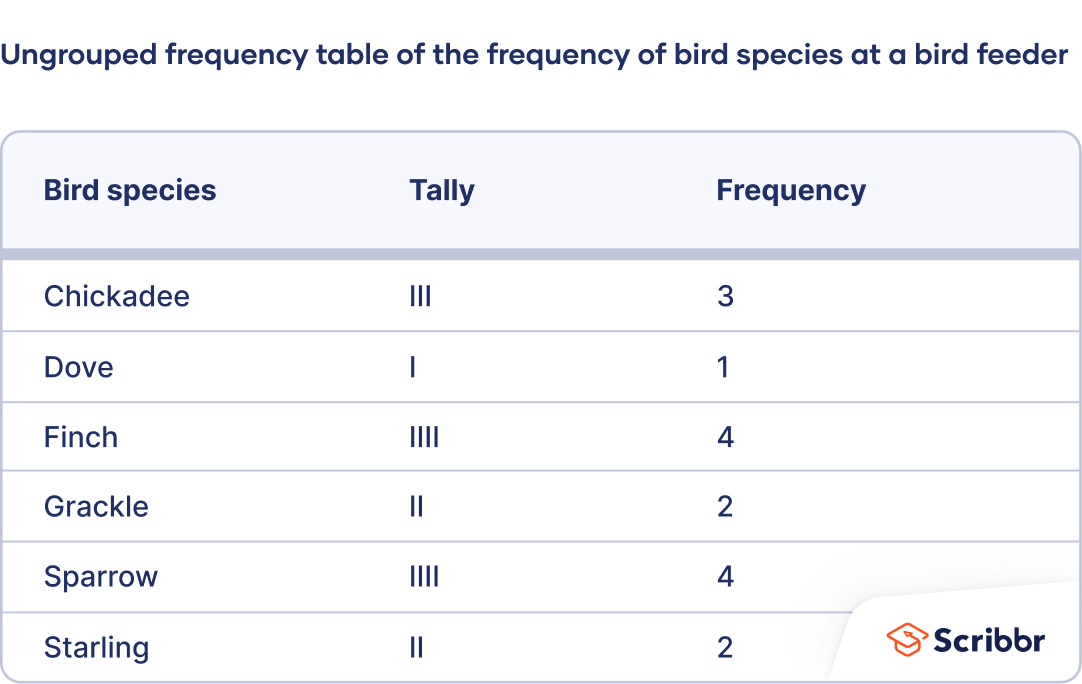
16
400
Find the mode of the following data set:
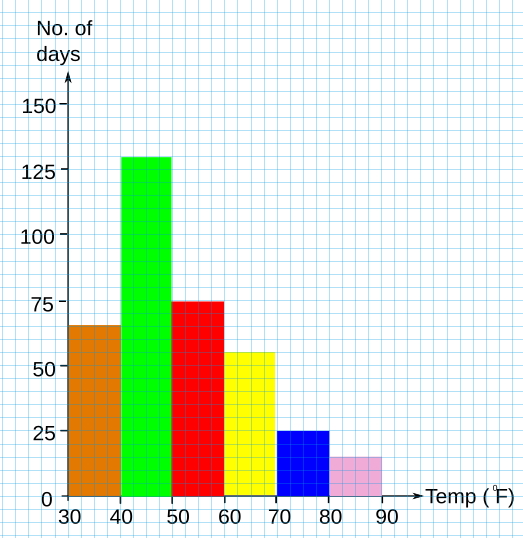
40oF
500
The government collected data on its latest policy proposal. The people surveyed answers 10 questions and were given three choices for each question: Agree, Disagree or Not Sure.
What type of data has the government collected?
Categorical & Nominal
500
The stem-and-leaf-plot represents the results achieved by students in a test:
0 | 6
1 | 2358
2 | 2446789
3| 014
What is the median for this data set?
24
500
List 3 things wrong about the following Frequency Histogram & Polygon.

- Gaps between the columns, they aren't touching
- No half-gap at the end of the columns
- No line to represent the polygon
500
A group of Year 11 students timed how long (in minutes) it took them to walk from school to the local train station:
12, 14, 15, 11, 15, 12, 14, 13, 12, 16
After sorting the times, two students argued about the median:
Jordan: “The median is 14 minutes because that’s the middle number once they’re in order.”
Sam: “No way, it’s 13 minutes — I checked, and that’s the middle number.”
They can’t both be right.
Work out the correct median.
13.5 minutes