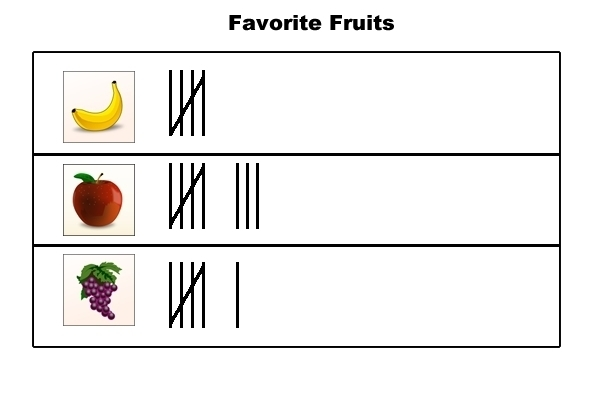
A graph that shows data using pictures or symbols
picture graph
 The greatest inches of snowfall during the week.
What is 10?

The number of days represented on the line plot.
What is 10?

What week did Reese hike the least amount?
Week 5

How many pull ups did he do on Saturday?
What is 25?
A graph that shows data using bars
Bar Graph

How many more votes did computers receive than space?
7

How many laps were swam the most?

The week Reese hiked about 2 1/2 miles.
What is Week 4?
How many students preferred the solar System Exhibit?
8 Students
A graph that uses marks above a number line to show data values
Line Plot

How many students voted in all?
What is 19?

What is this graph called?
Line Plot

What week did Reese hike the most?
Week 2

Did more people like the nature exhibit or human body exhibit?
Human Body
A table that gives the number of times something occurs

What is 4 1/2 inches

How many people swam 7 or more laps?
4 people

How many mile did he hike on weeks 1 and 2
6 1/2 miles
 0?
0?
How many students preferred the Light and Sound exhibit than the Solar System exhibit?
6 Students
A group of labels that shows the values at equally spaced grid lines
scale
What is the length of the purple line?
What is 5 1/4 inches?

How many students have 6 or more letters in their name?
7 Students
DAILY DOUBLE!

Did Reese hike more miles during weeks 5 and 6 or weeks 4 and 5?
Weeks 4 and 5

Which activity received 7 fewer votes than soccer?
Biking