Vocab
Bar Graphs
Line Plots
Parts of a Graph
Random
100
A type of graph that compares data using bars is called a _________
bar graph
100
Which pet got the least amount of votes?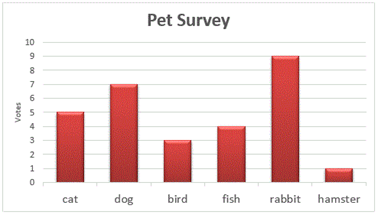
hamster
100
How many students have 5 pets?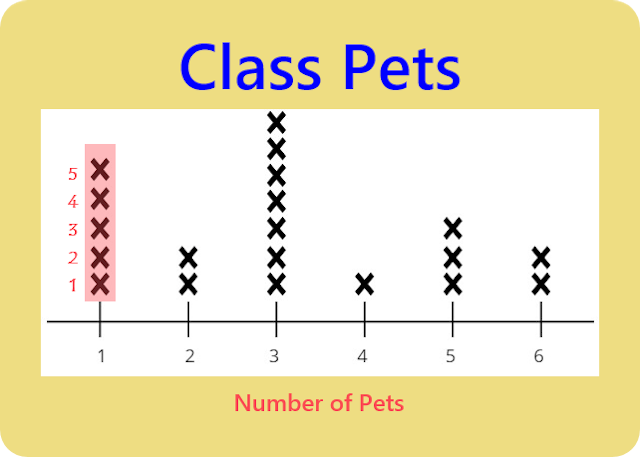
3
100
What could be a title for this graph?
Students' test scores
100
How many students play hockey?
20
200
The _____ tells you the value of each unit or symbol
key
200
How many children bake at home?
10
200
Which two sports have the same number of votes?

football and badminton
200
What is this part of the graph called?
the key
200
How many children chose cheese pizza?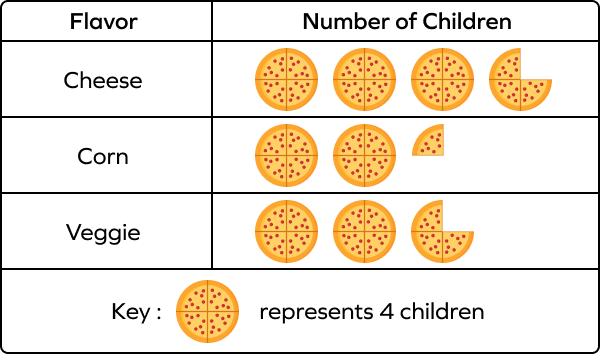
15
300
Information that is collected and represented on a graph is called _______
data
300
How many desks does Ms. Peters and Mrs. Wong have combined?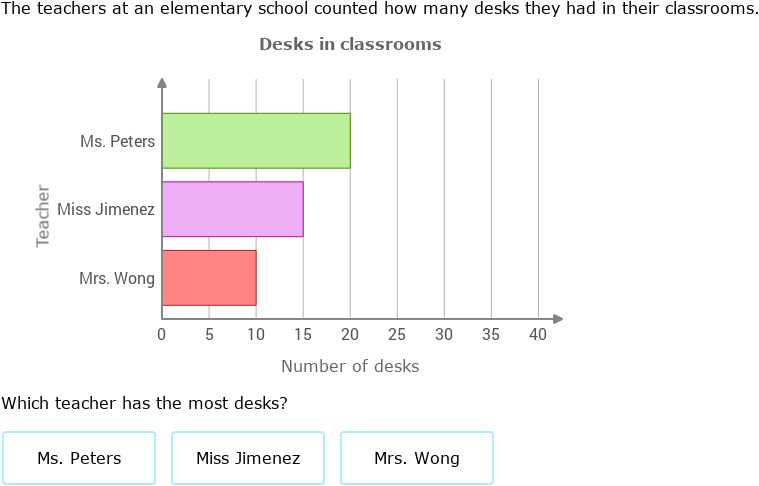
30
300
How many cars were sold on Saturday and Sunday?
8
300
What can I label the bottom of this bar chart?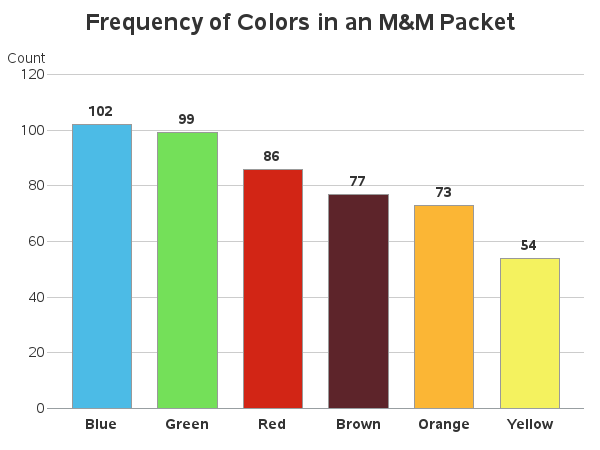
colors
300
If I use this data to create a line plot, what is the smallest number I need to put on my scale? What is the largest number?
smallest number: 1, largest number: 9
400
A set of numbers that shows the units used on a graph is called the ______
scale
400
How many more students want to go to the aquarium than the museum?
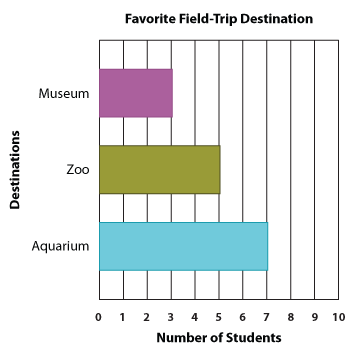
4
400
How many more people watched 2 movies per month than people who watched 5 movies a month?
2
400
What does each x represent?
a student
400
How many students voted for Wednesday and Friday combined?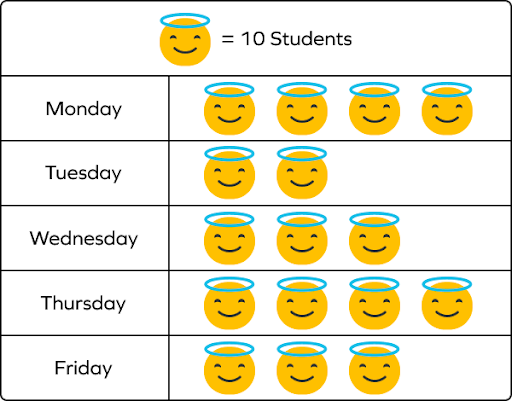
60
500
______ is the number of times the data value occurs
frequency
500
How many people were surveyed in total?
60
500
How many more children chose red and yellow combined than green?
6
500
What is missing from this bar chart?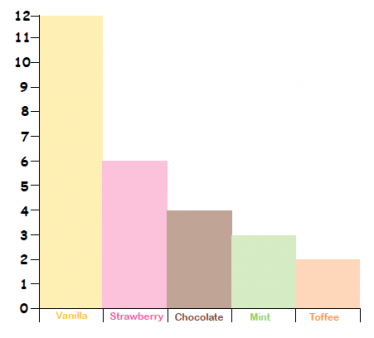
title and labels
500
How many more cupcakes were sold on Wednesday than Tuesday?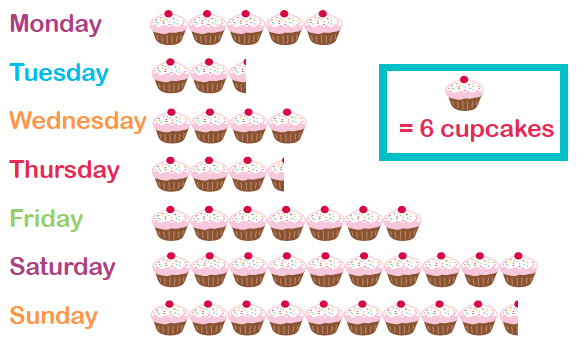
6