5A Statistical Reasoning
5B Should You Believe a Statistical Study?
5C Statistical Tables and Graphs
5D Graphics in the Media
5E Correlation and Causality
6A Characterizing Data
6B Measures of Variation
6C The Normal Distribution
100
If you conduct a poll in which you randomly select 1000 registered voters from Arkansas and ask if they approve of the job the governor is doing, _________ represents the population.
What is all registered voters in the state of Arkansas?
100
This term refers to any problem in the design or conduct of a statistical study that tends to favor certain results.
What is bias?
100
This type of data represents counts or measurements.
What is quantitative data?
100
This type of graphic represents a large, interrelated set of information and data in a visual way, with the goal of making it easy to understand and interpret all the information.

What is an infographic?
100
This is the type of graph used when determining the correlation of two variables.
What is a scatterplot?
100
This is the first step for finding the median is __________.
What is placing the data in order from least to greatest?
100
What is the range for the following set of data?
12, 81, 37, 25, 3, 19, 58, 22
What is 78?
81-3 = 78
100
In a normal distribution, these are all the same value.
What is mean, median, and mode?
200
If you conduct a poll in which you randomly select 1000 registered voters from Arkansas and ask if they approve of the job the governor is doing, _________ represents the sample.
What is the 1000 registered voters from Arkansas?
200
Mrs. Gorman decides to conduct a survey about her college math classes and chooses students with only with A's to participate in the survey. This type of bias is demonstrated here.
What is selection bias?
200
This type of data consists of values that can be placed into nonnumerical categories.
What is qualitative data?
200
This type of graph embellishes the information with additional artwork to make the graph more appealing (but may also distract or mislead).
What is a pictograph?
200
If the points on a scatterplot fall on a nearby straight line sloping downward, the two variables have this type of correlation.
What is a strong, negative correlation?
200
Find the mean of the following data:
14, 27, 33, 10, 7, 2
What is 15.5?
200
The five-number summary divides the data into quarters and consists of the following values (in order from least to greatest).
What is minimum, Q1 (median of the lower half), median, Q3 (median of the upper half), and maximum?
200
The normal distribution graph can be sectioned off by standard deviations. We can apply the __-__-__ rule to answer many questions about the frequencies of data values in a normal distribution.
What is 68-95-99.7% ?
300
When the participants and the experimenters do not know who belongs to the treatment group or the control group in an experiment, it is called ________.
What is double-blinding?
300
Mrs. Gorman decides to survey her college math classes about their favorite type of music. She sends out a voluntary google form to all of her students to make their choices. This type of bias is demonstrated.
What is participation bias?
300
When creating a pie chart, you should multiply the percentage by ______ in order to find the correct angle for the sector in the circle.
What is 360 degrees?
300
You have a histogram and you want to convert it into a line chart. A good first step would be to ________.
What is place a dot at the top of each bar, in the center of the bar?
300
If the points on a scatterplot fall into a broad swath that slopes upward, the two variables have this type of correlation.
What is a weak, positive correlation?
300
Find the median of the following data:
15, 3, 12, 4, 22, 36
What is 13.5?
300
The five-number summary for the following set of data is _____________.
4, 8, 9, 10, 13, 22, 36, 48, 55.
What is 4, 8.5, 13, 42, and 55?
300
The number of standard deviations a data value lies above or below the mean is called its standard score (or z-score), can be found using this formula.
What is z= (data value - mean)/ standard deviation?
z=(x - overlinex)/(S x)
400
This refers to a situation in which patients improve simply because they believe they are receiving a useful treatment.
What is the placebo effect?
400
According to a radio station call-in poll, KWRF said 95% of every radio listener enjoys the type of music they play. This type of bias could be demonstrated here.
What is selection and participation bias?
400
When creating a histogram or line chart and the data on the horizontal axis is an interval, you should mark the ________ as your x-coordinate on the graph.
What is the midpoint or center of the interval?
400
Qualitative or Quantitative? Grades on a report card listed as A, B, C, D, or F.
What is qualitative?
400
This type of correlation is demonstrated by the two following variables: number of books read monthly and waist size
What is no correlation?
400
If a distribution is skewed to the left (outliers at low values), the ________ is to the left of the median.
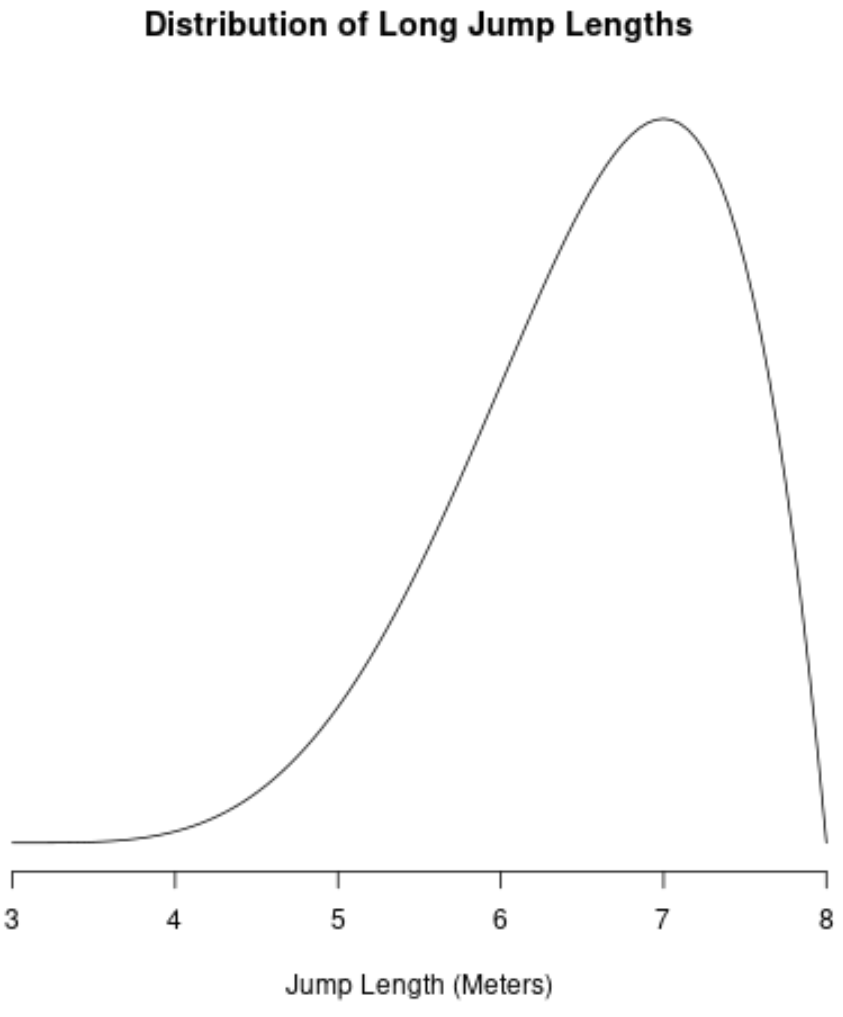
What is the mean?
400
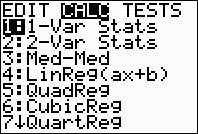
The standard deviation is ______ for the following set of data. (You may use your calculator or work out by hand.)
28, 36, 50, 33, 30, 40, 38
What is 7.3?


400
If a set of data has a standard deviation of 4 and a mean of 16, the z-score for 23 is ______.
What is 1.75?
500
These are the four common sampling methods.
What is simple random sampling, systematic sampling, convenience sampling, and stratified sampling?
500
This question refers back to 5A. After the survey, poll, or experiment is completed, these are the numbers that describe characteristics of the sample.
What is sample statistics?
500
Which of the following is an example of qualitative data?
1. Height in inches
2. Ratings of movies
3. Ticket prices at theaters
What is "Ratings of movies?"
500
A bar graph uses a set of bars to represent the ______ of each category.
What is frequency?
500
The three possible explanations for a correlation.
What is coincidence, common underlying cause, and direct cause?
500
A distribution in which most of the data values are clustered together has ___________ variation.

What is low?
500
The following data set gives the time intervals in minutes between eruptions of Old Faithful geyser in Yellowstone National Park.
98, 92, 95, 87, 96, 90, 65, 92, 95, 93, 98, 94
The mean is ______. The median is ______. The standard deviation is _______.
What is 91.2 (mean), 93.5 (median), and 8.85 (standard deviation)?
500
The scores on a science test were normally distributed with a mean of 67 and a standard deviation of 8. About _____ percentage of scores were less than 59.
What is 15.87% or approximately 16%?