This type of chart is best used to find the unique list of values in a column of a dataset
Bar chart
This type of chart is most useful for exploring two columns of a dataset when one or both are strings
Cross tab
Correlation does not imply ______
Causation
Data that is accessible to the public is called ____
Open data
This type of chart is best used to determine what range of values is least common in a column of a data set
Histogram
This type of chart is best used to see patterns and trends between two column of a dataset
Scatter chart
This process allows us to look at just a subset of a larger dataset
Filtering data
This is data that is collected by the general public
Crowdsourced data
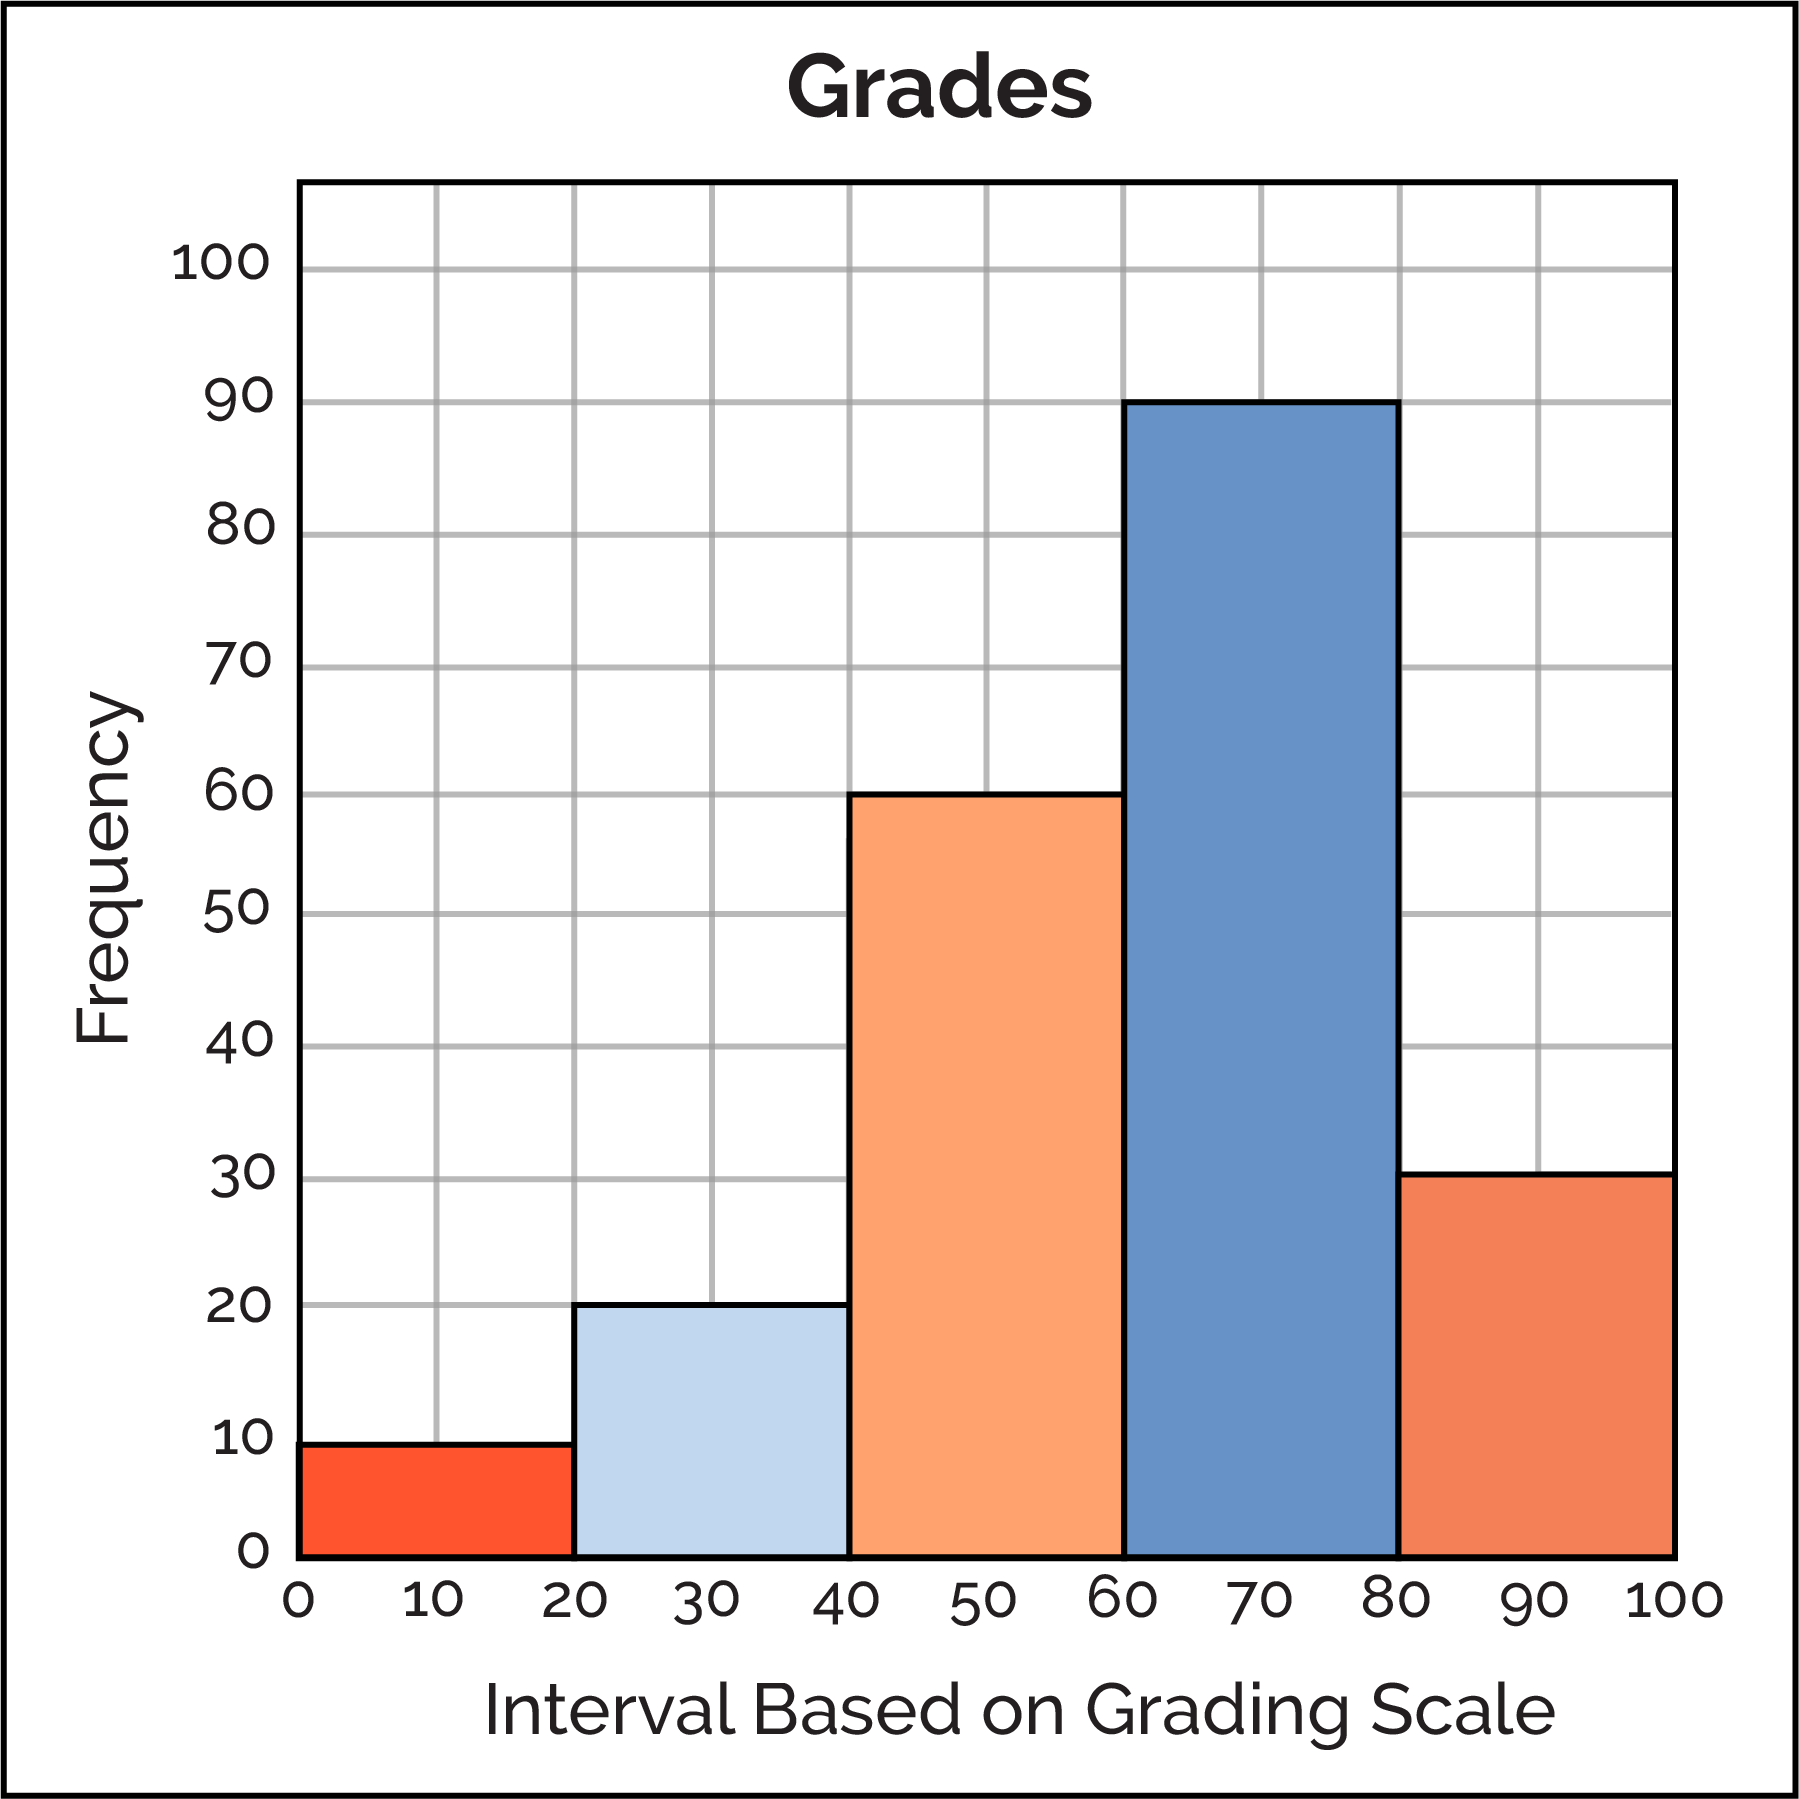
This is an example of which chart type
Histogram
This chart shows a general _______ between a state's area and its order of admittance in to the union
Correlation
The data analysis process can be described as a circle - how are the first and last steps related?
Generating new information helps us determine what questions to ask next
This type of data is essential in machine learning due to the required repetition in training
Big data
This type of chart is NOT useful when there are many unique values in a column of a data set
Bar chart
Cross tab charts are NOT useful when this is true about the data set
There are too many unique values (the chart would be too big)
These help us see patterns and trends that are not apparent in raw datasets
Data visualizations
Machine Learning algorithms trained on datasets that are NOT representative can result in this
Data bias
This phrase is used to describe the ranges of values used when creating a histogram
Bucket size
Scatter charts are NOT useful when this is true about the dataset
Users from the United States and United Kingdom responded to the same survey. This process is likely needed before the results can be analyzed
Cleaning data
This is included in datasets to give us information about the dataset itself
Metadata