Vocabulary
MMMR
IQR
True or False?
%
This or That?
100
The average of the data collected.
When you find the sum of all of the numbers, then divide by how many numbers in the data
MEAN
100
Dr. Cook held auditions for band after school. The data below shows the the number of students who auditioned each day.
22, 18, 18, 22, 24, 24, 4, 18, 21
What is the mean?
Mean is 19
100
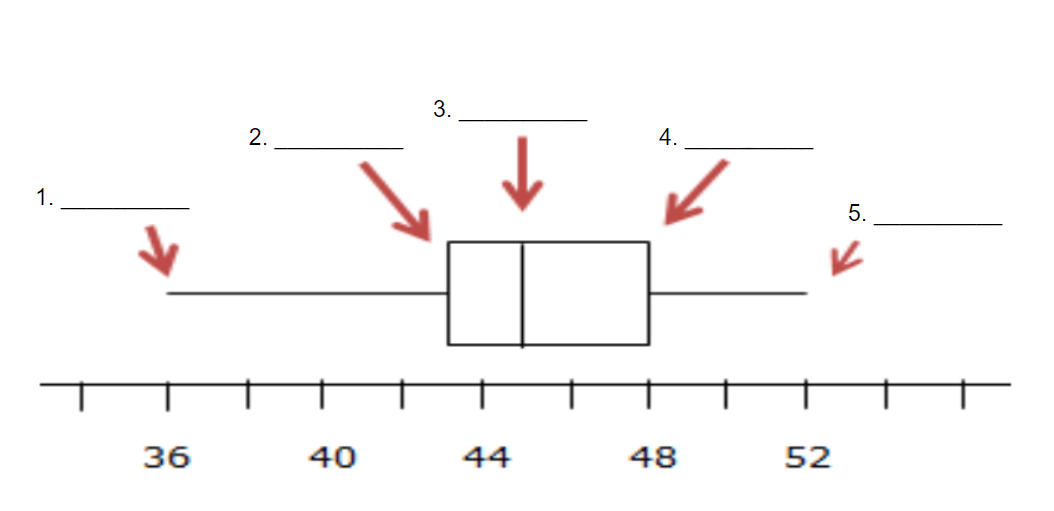
Label the box plot...
1. minimum (least)
2. Q1 (quartile 1)
3. median (middle)
4. Q3 (quartile 3)
5. maximum (greatest)
100
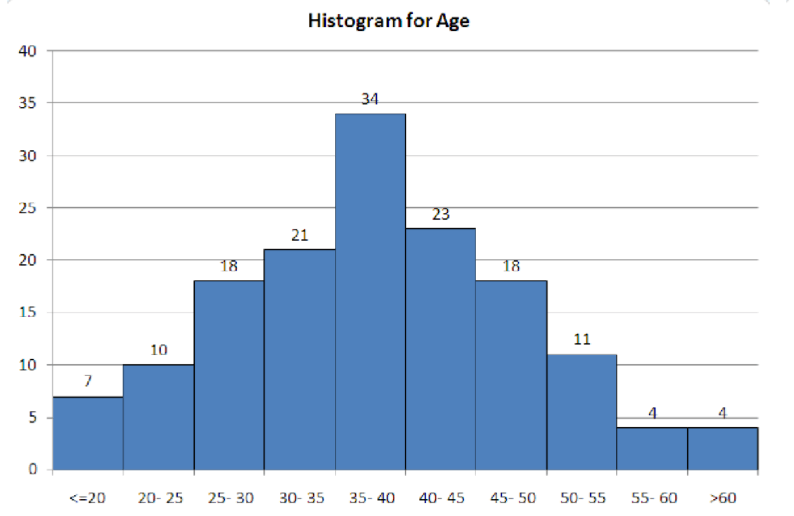
Which statement below is false?
1. The data is symmetrical
2. The data has an outlier
3. None of these statements are false
Statement 2 is FALSE
There is no outlier in the data
100
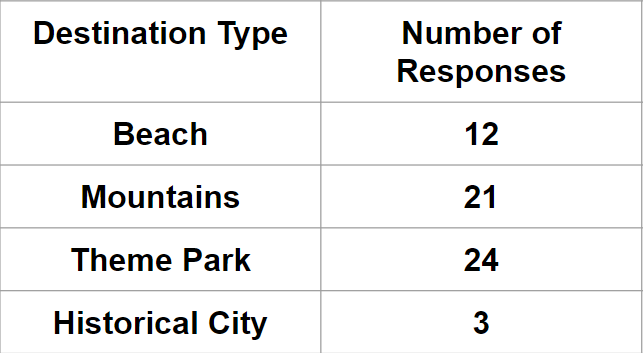
How many people were surveyed about their favorite vacation spots?
60 people were surveyed
100

Is the Histogram Symmetrical or Asymmetrical?
The data is Symmetrical
200
When you take the greatest value and subtract the least value.
Also known as the spread...
RANGE
200
Dr. Cook held auditions for band after school. The data below shows the the number of students who auditioned each day.
22, 18, 18, 22, 24, 24, 4, 18, 21
What is the median?
Median is 21
200
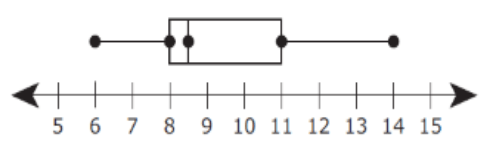
What is the IQR?
Q3 - Q1 = IQR
Q1: 8 and Q3: 11
11 - 8 = 3
IQR = 3
200
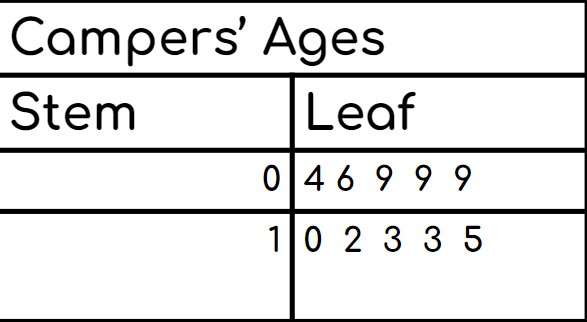
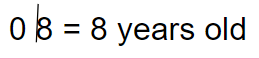
Which statement below is true?
1. There are 7 campers younger than 10
2. The most common age is 13
3. There are no students older than 15
Statement 3 is true.
The oldest camper is 15, so no students are older than 15.
200

Which statement is best supported by the data in the table?
1. Theme parks are the favorite destination with 24% for those surveyed
2. Theme parks are the favorite destination with 40% of those surveyed
3. Historical Sites are the least favorite destination with 30% of those surveyed.
Statement 2 is best supported.
24 out of 60 is 40%
200
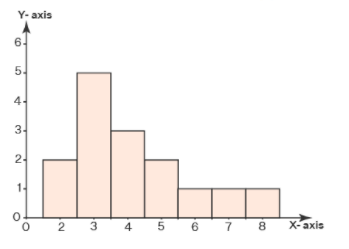
Skewed left or Skewed right?
The Histogram is Skewed Right.
300
The value that you see the most
MODE
300
Dr. Cook held auditions for band after school. The data below shows the the number of students who auditioned each day.
22, 18, 18, 22, 24, 24, 4, 18, 21
What is the mode?
Mode is 18
300
Dr. Cook held auditions for band after school. The data below shows the the number of students who auditioned each day.
22, 18, 18, 22, 24, 24, 4, 18, 21
What is the IQR?
IQR is 5
300
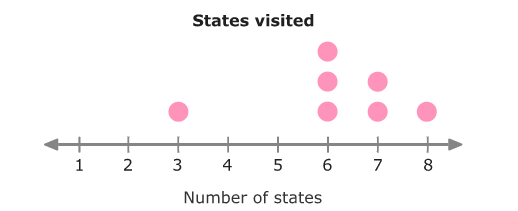
Which statement is true?
1. The data is not skewed
2. The spread of the data is 5
3. The distribution of data does not have an outlier
Statement 2 is true
Spread of data is also the range, so the least value subtracted from the greatest value.
8 - 3 = 5
300
FREE POINTS FOR ALL TEAMS
FREE POINTS FOR ALL TEAMS
300
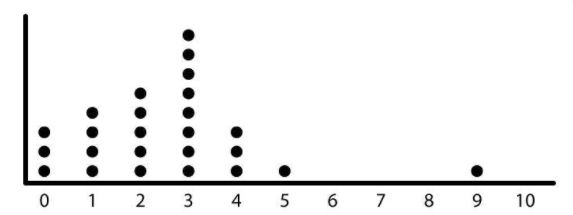
Is 9 the GAP or OUTLIER?
OUTLIER
400
The number in the middle.
When you place your numbers in order from least to greatest and mark off one on each end till you get to the middle.
MEDIAN
400
Dr. Cook held auditions for band after school. The data below shows the the number of students who auditioned each day.
22, 18, 18, 22, 24, 24, 4, 18, 21
What is the range?
Range is 20
400

What is the IQR?
10, 15, 16, 18, 18, 18, 19, 19, 20, 20
Median of the lower quartile is 16, median of the upper quartile is 19.
19 - 16 = 3
IQR is 3
400
The list shows a number of drivers licenses issued at the DMV for the last 6 weeks....
661 663 618 624 689 663
Which statement below is false?
1. The median is 662
2. The mode is 663
3. The range is 64
Statement 3 is FALSE
The range is 71 (689 - 618)
400
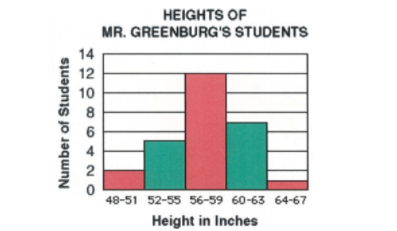
Which of the following is best supported by the data in the histogram?
1. More than half the children are 60 inches or taller
2. Exactly 12 students are 57" tall
3. There were 27 students surveyed
Statement 3
400
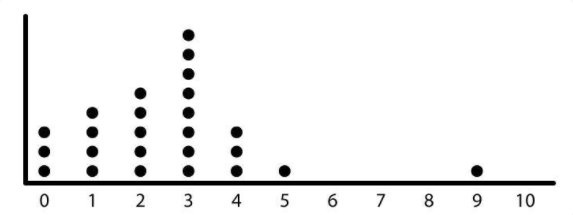
Is 6 - 8 the GAP or OUTLIER?
GAP
500
When you find the median of the lower and upper quartile, then find the difference.
IQR
Interquartile Range
500
Ms. McBrien's class scored the following grades on their last test: 80, 100, 95, 80, 60.
Please find the mean, median, mode and range of these grades.
Mean: 83
Median: 80
Mode: 80
Range: 40
500


What is the IQR?
4, 6, 9, 9, 9, 10, 12, 13, 13, 15
Median of lower quartile is 9, median of upper quartile is 13 so..
13 - 9 = 4
IQR is 4
500
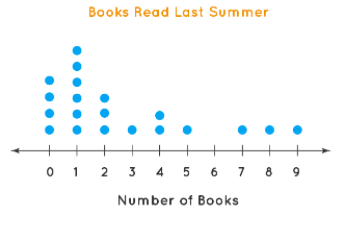
Which statement is false?
1. More than half of the students read 2 or less books
2. Twice as many students say they read 1 book versus 2 books
3. More than half of the students read 5 books or more
Statement 3 is false
500
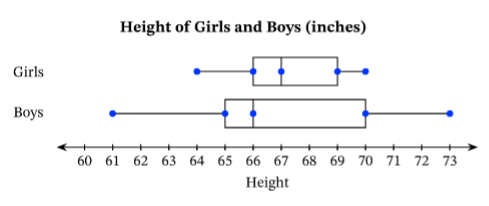
Which of the following statements does NOT support the data in the box plots?
1. Half of the heights recorded for girls is 66 inches or taller
2. The IQR for boys heights is 5
3. The median for boys height is 66 inches
Statement 1 does not support the data in the box plot.
Half of the heights recorded for girls is 67 inches or taller
500
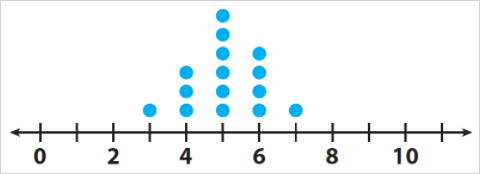
Does the Dot Plot show a CLUSTER or OUTLIER?
CLUSTER