Measure of Center
Stem-and-Leaf Plots
Define
Histograms
Misc.
100
The "average" of a set of data
Mean
100
How many plants were measured?

There 12 plants measured.
100
Mean
What is average?
100
What type of graph is a histogram?
Bar graph
100
Find the Mean.
2, 4, 5, 6, 2, 3, 1, 1
3
200
How must data be organized before you can find the median?
in order from least to greatest
200
What is the difference between the fastest and shortest time?

The difference is 3.8 seconds
200
Median
Middle
200
Histograms represent
a) simple data values
b) frequencies of numeric data in intervals
b
200
Find the median.
5, 7, 10, 3, 6, 7, 2
6
300
Explain how to find the mean of a data set
Add the data values and divide by the number of the data values
300
How many plants are less than 40 cm in height?
There are 7 plants that are less than 90 centimeters in height.
300
What are data values that are either much greater or much less than the other data values?
Outliers
300
true or false:
In a histogram the numerical information is always groups in intervals.
True
300
Find the range.
4, 10, 17, 22, 30
26
400
Find the median:
1, 4, 6, 8, 10, 17
7
400
How many numbers were recorded in the stem- and- leaf plot?

There are 16 numbers recorded in the stem- and- leaf plot.
400
Bar graph that shows continuous data (all parts touch)
What is a Histogram?
400
How does a bar graph and a histogram differ?
Histograms have intervals.
400
Find the mode.
2, 8, 4, 2, 7, 4, 9, 10, 4, 16
4
500
Find the mean:
1, 3, 5, 7, 2, 6
4
500
What is the median length of Serena's pencils?

The median length of Serena's pencils is 4 3/4 inches.
500
What is the Mean Absolute Deviation?
The mean of the absolute deviations of a set of data.
500
How many students are represented in this graph?
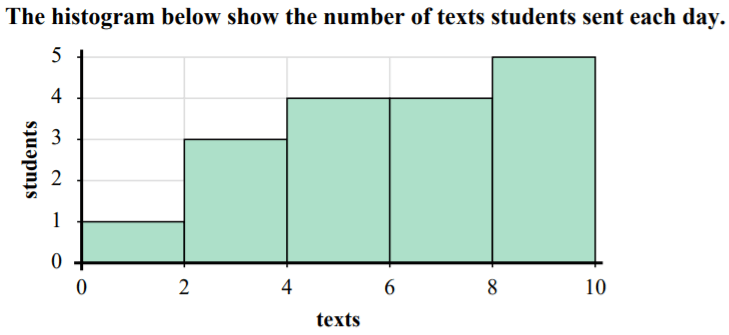
17
500
What are the steps for finding Mean Absolute Deviation?
1. Find mean
2. Find how far each is from mean - absolute value- and add
3. Divide by number of parts