Shape of a Distribution
Measures of Center and Variability
Vocabulary
Box Plots
Histograms
100
[ 5, 7, 7, 7, 8, 11, 15, 93]
Find the mode of the data set.
7
100
What is the mode?
The most repeated data value.
100
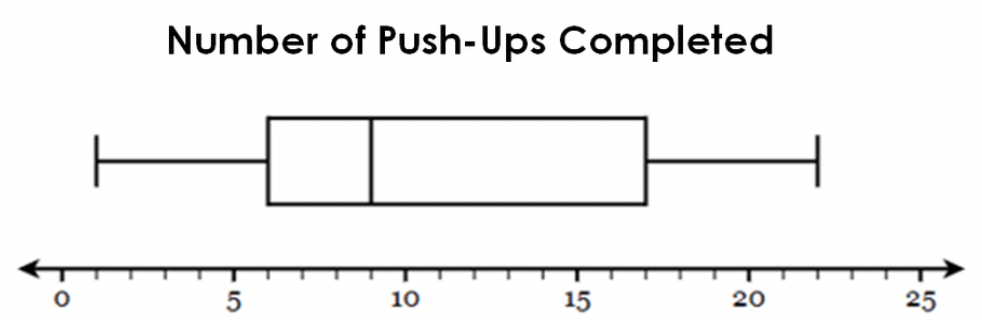
The _____ is at 1 and the _____ is at 22.
- minimum
- maximum
100
The histogram shows the amount of time, in minutes, that students spend playing video games each day.

How many students were surveyed?
25
200
[ 5, 7, 7, 7, 8, 11, 15, 93]
Find the median of the data set.
(7+8)/2=7.5
200
What do you do to find the range?
maximum - minimum
subtract the smallest number from the largest number
200

The _____ is at 6 and the _____ is at 17.
- lower quartile (Q1)
- upper quartile (Q3)
200
Is there a gap in the data? If so, explain where it is.

yes, between 80 and 90.
300
A graph where the median, mode and mean have the same value.
What is symmetrical?
or
What is normal distribution?
300
[ 5, 7, 7, 7, 8, 11, 15, 93]
Find the mean of the data set.
19.125
300
What do you do to find the median?
-order numbers from least to greatest
-find the middle value
300

The median of the data is at _____ .
9
300
What is the shape of the data?
skewed right
400
A graph where mode and median are less than the mean is an example of...
What is positive skew?
400
[ 5, 7, 7, 7, 8, 11, 15, 93]
Find the range of the data set.
88
400
What do you do to find the mean?
- add all values together
- divide by the count of values that were added
400

The range of the data is _____ .
21
400
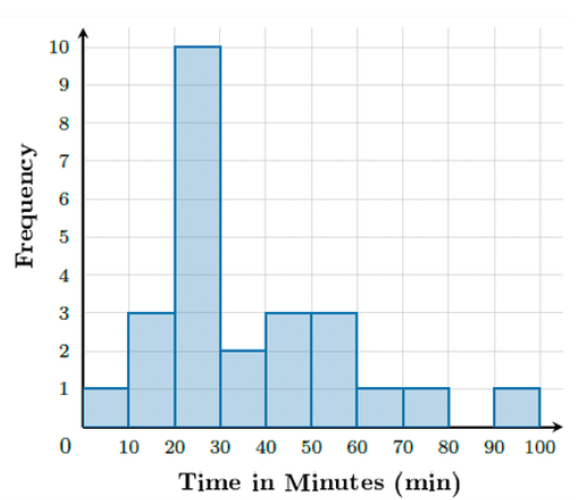
Could there be a student who spent:
17 minutes?
64 minutes?
82 minutes?
99 minutes?
105 minutes?
yes
yes
no
yes
no
500
A graph where mode and median are greater than the mean is an example of...
What is negative skew?
500
[ 5, 7, 7, 7, 8, 11, 15, 93]
93 is considered an outlier in this data set because...
What is Q3 + 1.5x IQR < 93
500
How do you find the interquartile range?
Q3 - Q1
find the difference or distance between the lower and upper quartiles.
500

The interquartile range of the data is _____ .
11
500
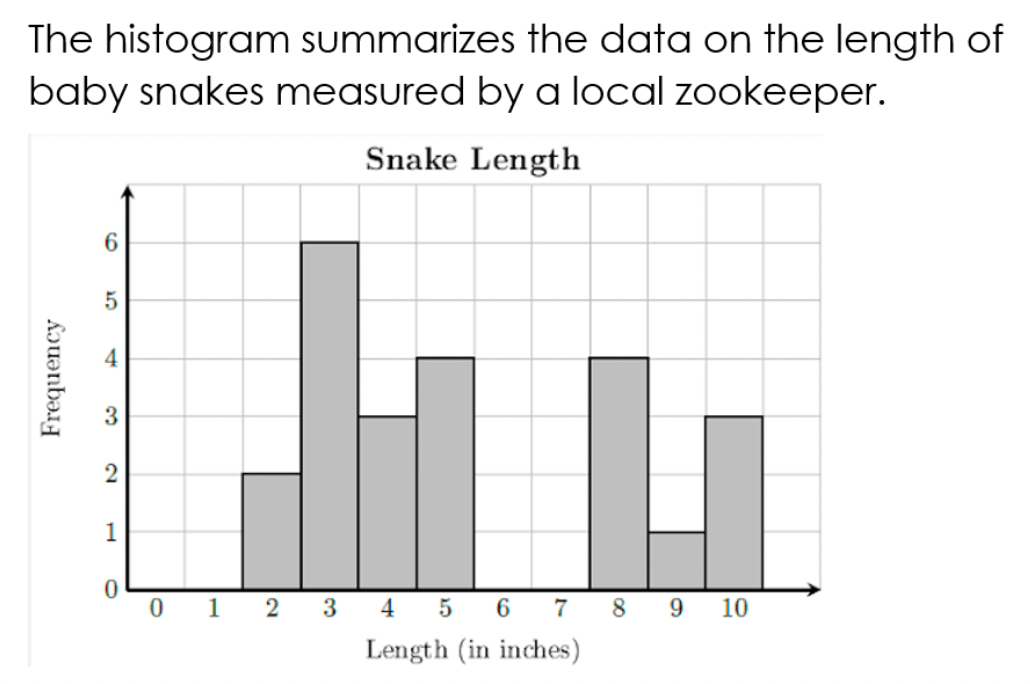
The histogram has _____ clusters and if a 23 inch baby snake were added to the data, it would be an _____.
two
outlier