Averages
Graphs
Probability
Tallies
Pot Luck
100
How do you work out the range?
Take away the lowest number by the highest
100
What does SALT stand for?
Scale, Accuracy, Labels, Title
100
How would you describe 0.5 or 1/2 in probability?
Even Chance
100
How many people chose orange juice? 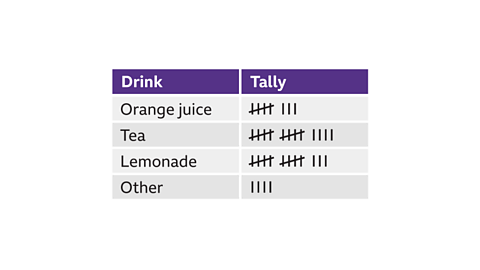
8
100
How many degrees in a quadrilateral?
360°
200
How do you work out the mean?
Add up all the values and divide by the number of them
200
How many year 7s have brown eyes?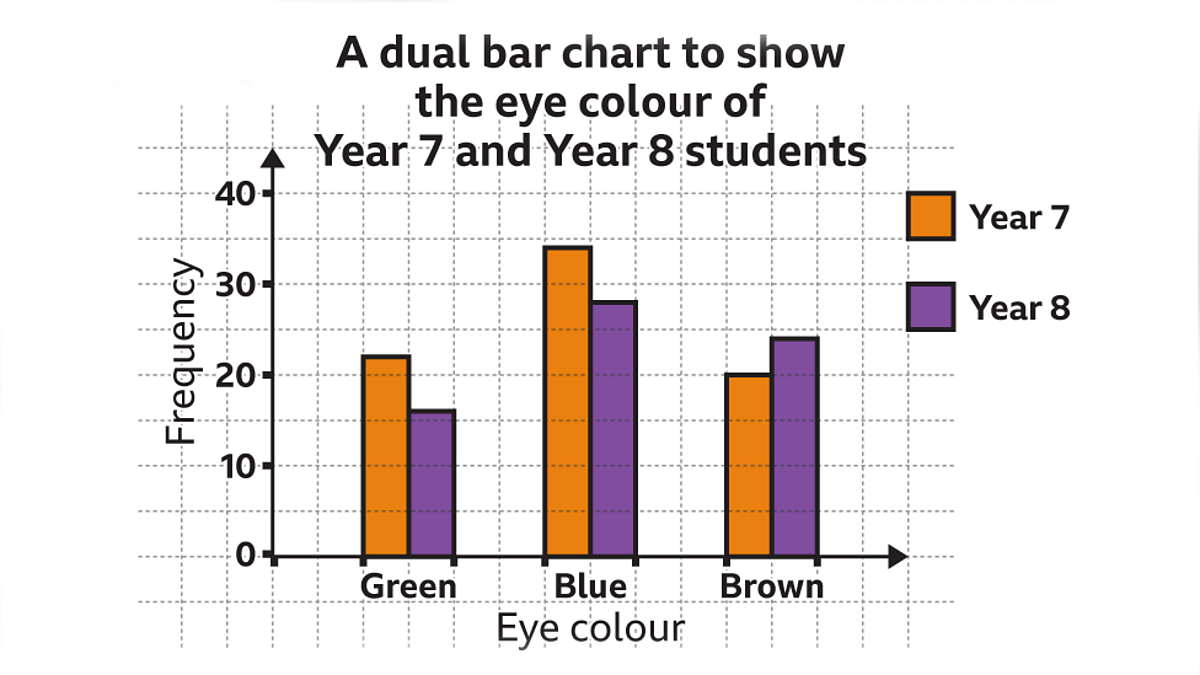
20
200
What is the probability of rolling a number higher than a 4 on a fair 6 sided dice?
2/6 or 1/3 or Unlikely
200
Why do we use tally charts?
To collect discrete data quickly and efficiently
200
How do you find the Area of a Triangle
Base x height ÷ 2
300
£100, £96, £5043, £178, £102, £148
Out of this data, what would be the anomaly?
£5043
As it's considerably more than the others.
300
What is wrong with this line graph? 
There is no title
The scale is inaccurate
300
What fraction represents the greater likelihood 1/24 or 1/36?
1/24
300
What would this look like as a tally chart
car bus car car train bus walk bus train walk train bus
Car - III
Bus - IIII
Train - III
Walk - II
300
Split £100 into the ratio 1:3
25:75
400
What is the range of this data?
0.12, 0.03, 1.53, 0.5, 0.09
1.5
400
Generally speaking you'd use a bar chart to represent what type of data?
Discrete - data that can be counted
400
Jill is selling 20 shirts. 5 blue, 8 white and 3 red the rest are black. What is the probability of selecting a red shirt at random?
3/20 or 0.15
400
What is discrete data?
Data that can be counted
400
What is 14/20 as a decimal?
0.7
500
Why would writing 5 + 10 + 21 + 18 + 7 ÷ 5 into a calculator to find the mean get you the wrong answer?
It would follow BIDMAS and do the divide bit first
500
Generally speaking you'd use a line graph to represent what type of data?
Continuous - data that is measured
500
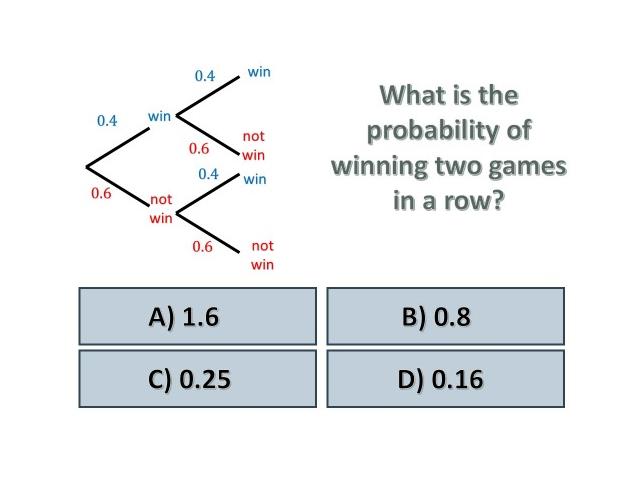
D. 0.4 x 0.4 = 0.16
Unlikely
500
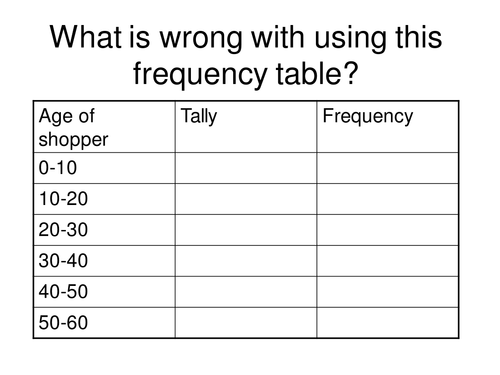
The groups are overlapping
500
What is 15 minutes as a decimal?
0.25