Measure of Center
Stem-and-Leaf Plots
Define
Histograms
Mean, median, mode, range
100
What is a cluster? What is a gap?
Cluster - values all grouped together
Gap - no values
100
The weights of students are shown below. How much did the lightest student weigh?

40kg
100
Mean
What is average?
100
What type of graph is a histogram?
Bar/column graph
100
Find the Mean.
2, 4, 5, 6, 2, 3, 1, 1
3
200
How must data be organized before you can find the median?
In order from smallest to largest
200
The weights of students are shown below. How many students were weighed?
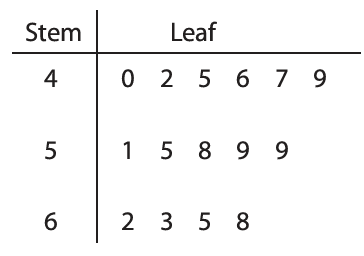
15 students
200
Median
Middle
200
What are the three types of skewness of a graph?
Left Skewed, Right Skewed, and Symmetrical
200
Find the median.
5, 7, 10, 3, 6, 7, 2
6
300
What is modality of a graph?
How many modes (most common) are in a graph
300
The weights of students are shown below. How many students weighed between 50 to 60kg?
5 students
300
What do we call data values that are either much greater or much less than the other data values?
Outliers
300
True or False:
Removing an outlier can impact the mean, median, mode and range of a data set
True
300
Find the range.
4, 10, 17, 22, 30
26
400
What does it mean for a graph to be symmetrical?
Graph is the same on both sides of the peak
400
The weights of students are shown below. What was the range of weights?
68 - 40 = 28
400
What type of bar graph has frequency on one axis with no gaps?
Frequency histogram
400
How does a bar graph and a histogram differ?
Histograms have intervals.
400
Find the mode.
2, 8, 4, 2, 7, 4, 9, 10, 4, 16
4
500
Find the mean:
1, 3, 5, 7, 2, 6
4
500
The weights of students are shown below. What was the average?
809/15 = 54kg
500
Range is a measure of ...
Spread
500
How many students are represented in this graph?
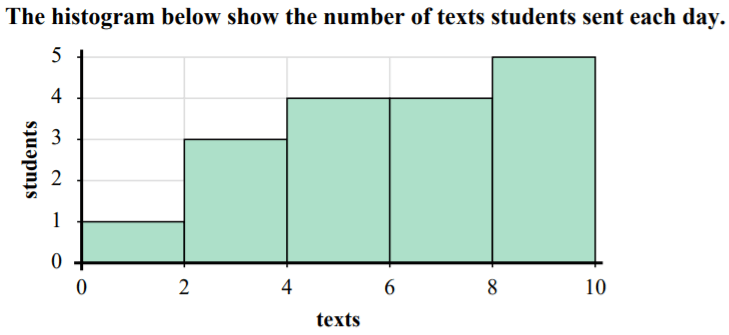
17
500
If a bar graph is negatively skewed, the tail of the graph goes down towards the ...
Left