Box Plots
Line Plots and Dot Plots
Histograms
100
What is the median of this data set?
10, 11, 14, 9, 11, 13, 12, 14, 15
12
100
What is the mode of this data set?
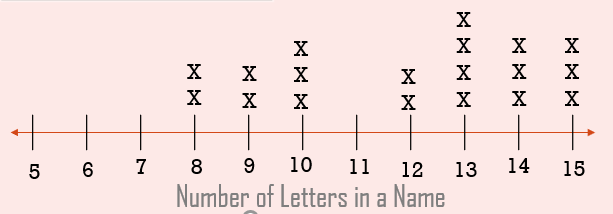
13 letters
100
According to the histogram, how many trees are between 150 cm and 200 cm?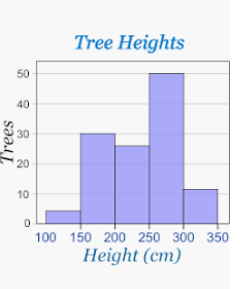
30 trees
200
Find the mean for the data set below.
10, 11, 14, 9, 11, 13, 12, 14, 15
Mean: 12.11
200
What is the range of this data set?
15 - 8 = 7 letters
200
According to the histogram, how many trees are between 250 cm and 300 cm?
50 trees
300
What is the range of this data set?
37, 43, 28, 55, 45, 32, 48, 37
55 - 28 = 27
300
What is the median of this data set?
3 hours
300
What is the interval size for the tree heights?
50 centimeters
400
Identify the Q1, Q3 and IQR of the data
20, 27, 23, 28, 25, 21, 27, 26, 25, 24, 22
Q1: 22 Q3: 27 IQR: 5
400
What is the median of this data set?
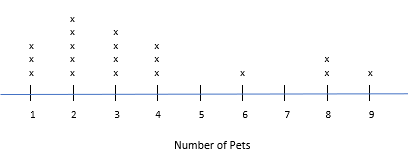
3 pets
400
How many trees are at least 250 cm tall?
61 trees
500
Find the minimum, Q1, median, Q3, maximum, and IQR for the following:
9, 13, 8, 11, 9, 10, 7, 12, 10
Min: 7 Max: 13 Median: 10
Q1: 8.5 Q3: 11.5
IQR: 3
500
What is the mean of this data set?
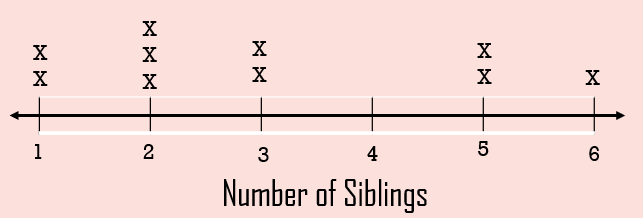
3 siblings
500
About how many trees are between 150 cm and 300 cm?
107-108 trees