Analyze Graphs
Stem-and-Leaf
Frequency Table
Dot Plot
Fractions and Decimals
100
On the dot plot, how many students have nose sizes of 1 3/4?
6
100

The two youngest guests are Lisa’s brothers. How old are they?
seven and eight years old
100
The heights of all the players on the South High School basketball team are shown in the frequency table below.

What is the most common height among the players?
six feet
100
The fourth-grade science class is measuring the height of plants as part of an experiment.
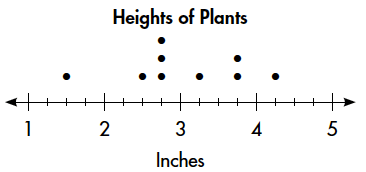
Which plant height is most common?
two and three fourths
100
write 0.8 as a fraction
8/10
200
Looking at your stem and leaf plot, what are the smallest and biggest values.
11.5 and 16.4
200
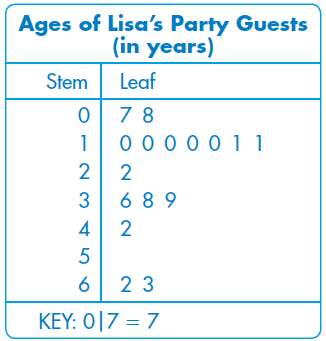
Lisa’s age is the same as the age of the greatest number of her guests. How old is she?
ten years old
200
The heights of all the players on the South High School basketball team are shown in the frequency table below.
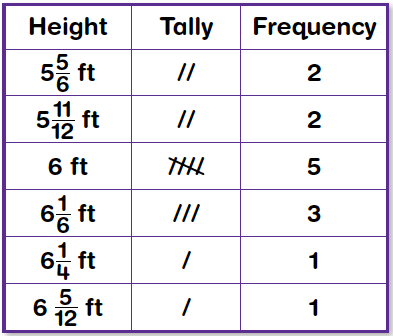
How tall is the shortest basketball player?
five and five sixths feet
200
The fourth-grade science class is measuring the height of plants as part of an experiment.

Is there an outlier in the data? If so, what height is it?
Yes, one and two fourths
200
write 5/10 as a decimal
0.5
300
Looking at your stem and leaf plot, what is the number that is 10x the smallest value.
115
300

How old is the oldest party guest?
sixty-three years old
300
The heights of all the players on the South High School basketball team are shown in the frequency table below.

How many basketball players are on the team?
fourteen players
300
The fourth-grade science class is measuring the height of plants as part of an experiment.

How many plants does the class measure?
nine
300
write 45/100 as a decimal
0.45
400
If 4 more students were added to the scatterplot with nose sizes less than 1 7/8 how many students would have noses less than 1 7/8?
15
400

How many party guests are older than 38 years old?
four party guests
400
The heights of all the players on the South High School basketball team are shown in the frequency table below.

How many basketball players are taller than 6 feet?
five players
400
The fourth-grade science class is measuring the height of plants as part of an experiment.

Which are there more of: plants with heights greater than 3 inches, or less than 3 inches?
less than 3 inches
400
write 0.72 as a fraction
72/100
500
Looking at the frequency table, what is the difference between the number measured less than 1.4 and more than 1.4
17
500

What is the difference between the ages of the oldest and youngest party guest?
fifty-six years
500
The number of times a response occurs is its ____________.
frequency
500
How can you use a line plot to identify the value in a data set that occurs most often?
Count the dots above each value OR find the data value that has the highest column of dots
500
write 4/100 as a decimal
0.04