BAR GRAPHS
FREQUENCY TABLE
DOT PLOT
STEM AND LEAF PLOT
SCATTERPLOT
100
What should a proper bar graph include?
What are a title, x-axis and y-axis labels, scale, and bars?
100
The symbol used to create marks in a frequency table.
What is a tally mark?
100
The first step in creating a dot plot.
What is a number line?
100
When creating a stem and leaf plot, you must have a column labeled stem, a column labeled leaf, values, and a ______.
What is a key?
100
The number of people who played 7 games.

What is 3 people?
200
A type of graph in which an amount is shown using vertical or horizontal rectangular bars.
What is a bar graph?
200
The number of students who voted for both yellow and blue as their favorite colored skittle.

What are 12 students?
200
The total number of students who ate breakfast.
What are 40 students?
200
True or False: A stem and leaf plot will always have whole numbers.
What is false?
200
A scatterplot is another way to represent this.
What is data?
300
The food that was voted the second most.

What is hamburgers?
300
The total number of students who voted for their favorite colored skittle.
What is 33 students?
300
How many basketball players are taller than 5'6?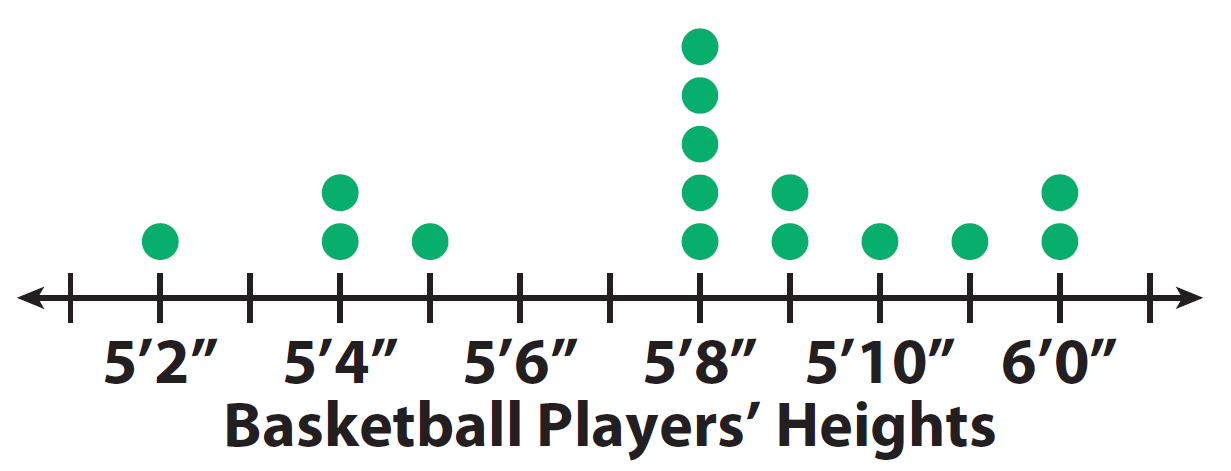
What is 11 basketball players?
300
The difference between the highest value and the lowest value.

What is 32?
300
The data that is represented in the scatterplot below

What is dolphin population and temperature?
400
True or False: The number of students who voted for pizza is less than tacos.
What is false, the number of students who voted for pizza is greater than tacos?
400
How many students scored an even amount of points?
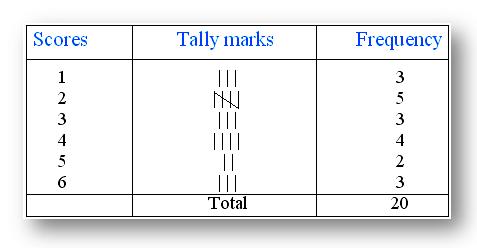
What are 12 students?
400
If each dot represented 4 players, how many players are in between 5'2 and 5'5?
What are 16 players?
400
The total number of values in this stem and leaf plot.
What is 10 values?
400
A trend that you see between the number of games and the scores.
What is as the number of games increased, the scores increased?