Bar Graphs
Dot Plots
Pictographs
Frequency Tables
Unit Vocabulary
100
What team scored the most points?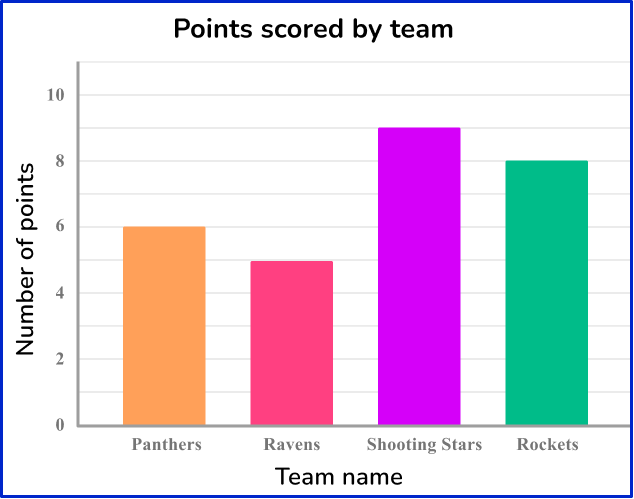
Shooting Stars
100
How many people were 83 inches tall?
3 people
100
What is the key?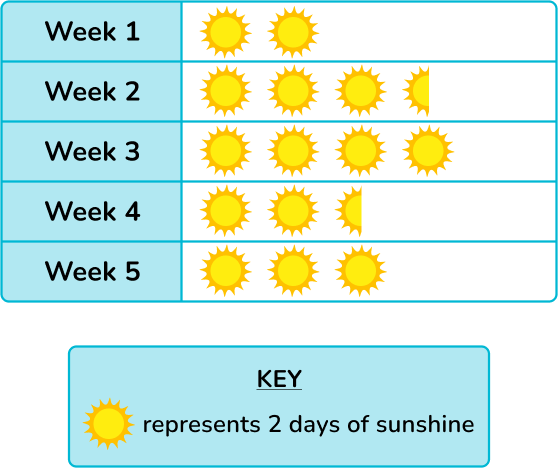
2
100
What day was the most frequent?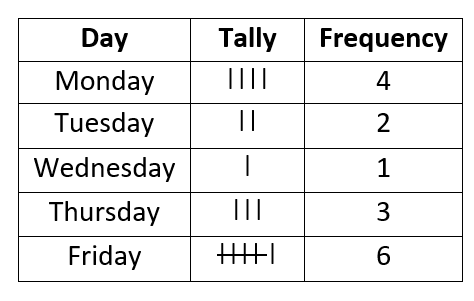
Friday
100
What the graph is counting by is called the ________
scale
200
What team scored the least amount of points?
Ravens
200
How many people are 85 inches tall?
4 people
200
How many days of sunshine did Week 3 have?
8 days
200
What type of vehicle was the LEAST frequent?

Bus
200
A ____ tells you what you are counting by
key
300
How many more points did the rockets score than the ravens?
3 points
300
How many people were 82 and 86 inches tall?
3 people
300
How many days of sunshine did Week 1 and 3 have?
12 days
300
What was the total frequency of apples and grapes?
13
300
A graph will ALWAYS have a key. True or False
False
400
What is the total number of points scored by the ravens and shooting stars?
14 points
400
What is the total number of people surveyed?
15 people
400
How many more days of sunshine did Week 3 have have than Week 5?
2 days
400
What was the total frequency for all cars surveyed?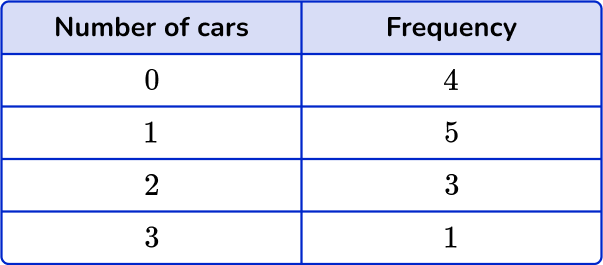
13
400
A bar graph has a _______ and ___________ axis
horizontal , vertical
500
What is the total number of points scored?
28 points
500
How many people were 84 inches or taller?
10 people
500
What does the half sun represent?
1
500
What number of puppies was the most frequent?
6 puppies
500
A _______ is where a question is asked and people respond to it.
survey