Histograms
Dot Plots
Box Plots
Vocabulary
Calculations
100
How many students phone bills were less than 41?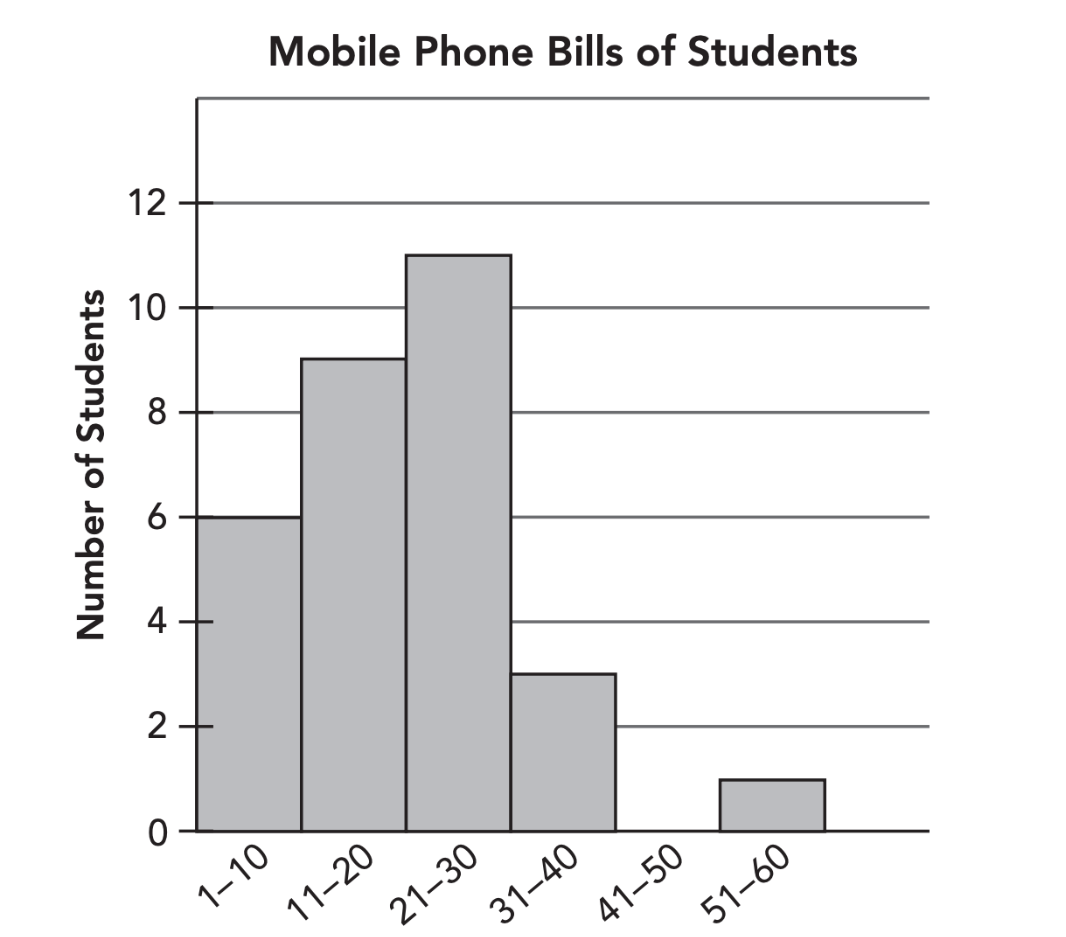
29
100

What is the mean of the paint orders
3.43
100

6
100
How do you find the mean?
average of the data?
add all data and divide by the number of data points
100
Determine the range of the data
2, 3, 5, 7, 8, 10, 11, 11, 13, 15, 17, 18
16
200
What is the shape of the data?
Skewed right
200
What is the range of the data?

7
200

Steven, 3 hours
200
Describe data that is skewed left.
The tail is on the left of the data.
200
Find the mean of the data
4, 5, 8, 1, 2, 3, 9, 8, 7, 6, 2
5
300
How many teachers were employed for more than 3 years?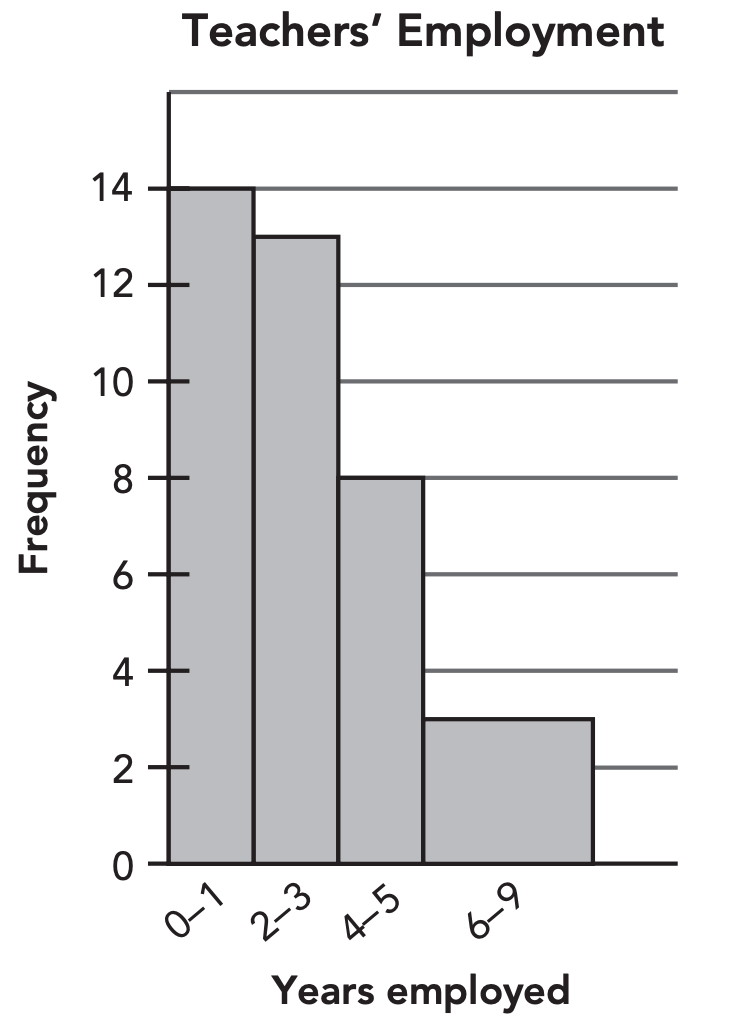
11
300
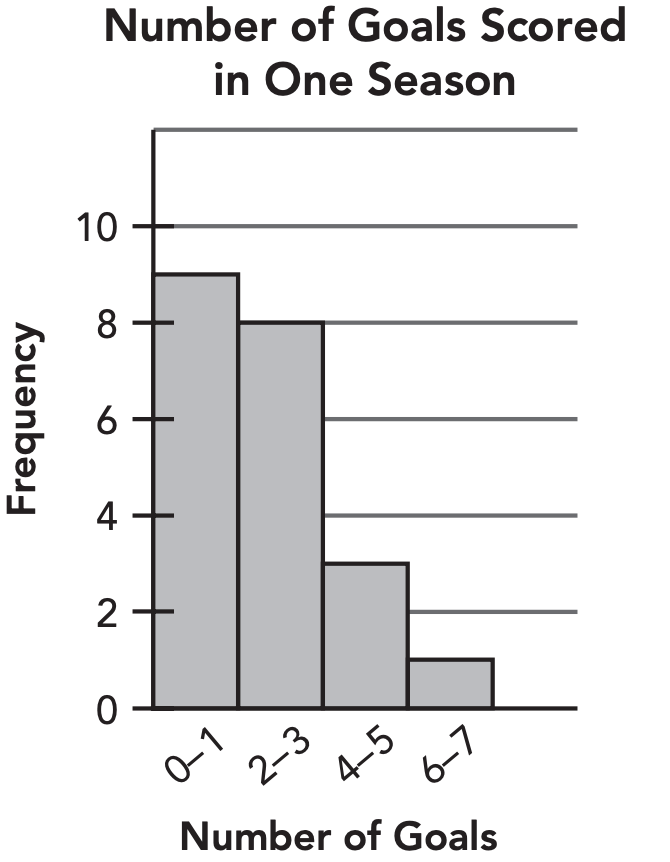
What is the median of the data? 
2
300
Determine the IQR
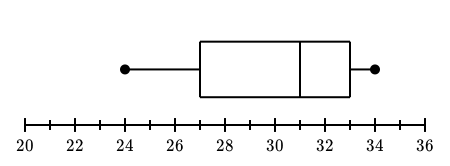
6
300
Which would you use to compare data that is skewed right? Mean or median
Median
300
Find the standard deviation of the data
23, 10, 11, 24, 32, 15, 13, 16
7.63
400
How many households were surveyed on their vehicle age?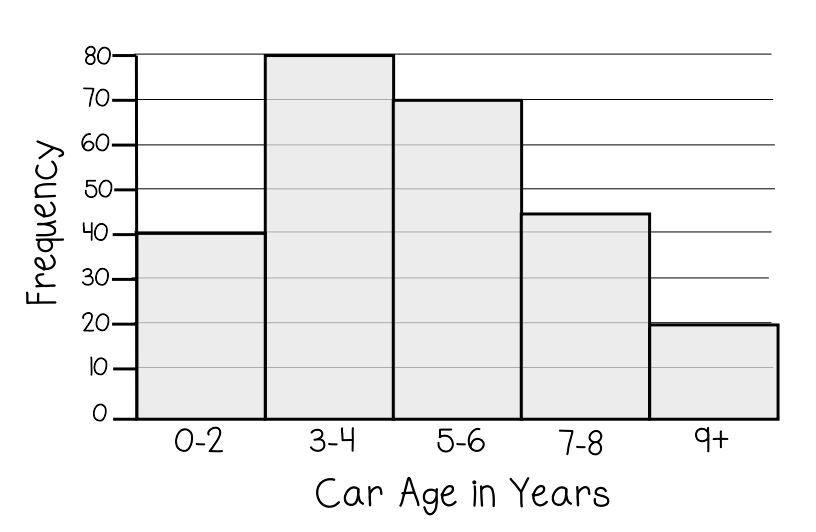
255
400
 what is the shape of the data?
symmetrical
400
What would you use to compare the temperature in Dallas? Mean or median Why?
Mean because both data is symmetrical
400
How do you find IQR?
Q3 - Q1
400
Class 1: {68, 93, 53, 100, 77, 86, 91, 88, 72, 74, 66}
Class 2: {77, 91, 82, 68, 75, 72, 85, 65, 70, 79, 94}
Compare the range of both classes.
Which class had a larger range?
A: 47
B: 29
Class A
500
If you were to compare the data in this histogram to another histogram with a similar shape would you use the mean or median? Why?

Mean because the data is symmetrical
500

What would you use to compare this dot plot to another with a similar shape, IQR or Standard Dev? Why?
IQR, because the data is skewed
500
 Whuch group has the most symmetrical data?
D
500
What is the lowest point of a box plot called?
Minimum
500
Class 1: {68, 93, 53, 100, 77, 86, 91, 88, 72, 74, 66}
Class 2: {77, 91, 82, 68, 75, 72, 85, 65, 70, 79, 94}
Compare the standard deviations of both classes.
Which class was more consistent?
B, it had a lower standard deviation