Mean, Median, Mode, & Range
Adding Integers
Vocabulary
Box and Whisker
Dot Plot
100
The mode of this data set:
6, 5, 2, 9, 6, 3, 0
What is 6?
100
(-3)+8
5
100
Define:
Mode
Number that happens the most.
or
Most frequent number.
100
The median of this Box and Whisker Plot:

What is 30?
100
The mode of this frequency table:

What is 2?
200
The range of this data set:
4, 7, 9, 2, 4, 9, 12, 6
What is 10?
200
(-6)+(-4)=
-10
200
What does Quartile mean?
Quarter or 25%
200
The minimum of this Box and Whisker Plot:

What is 15?
200
The Median of this frequency graph:
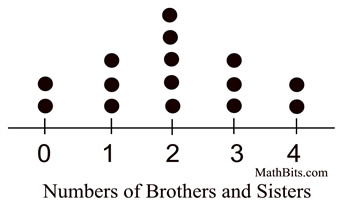
What is 2?
300
The median of this data set:
0, 1, 3, 5, 6, 8, 9
What is 5?
300
23 + (-10) =
13
300
How do you find the MEAN of a set of numbers?
You add all the numbers, then divide by how many numbers there are.
300
The Upper Quartile (Q3) of this Box and Whisker Plot: 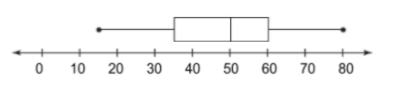
What is 60?
300
How many Giraffes were measured?
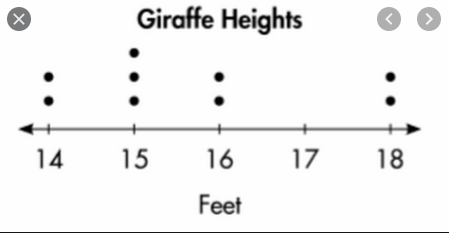
What is 9?
400
The median of this data set:
6, 4, 0, 1, 7, 2, 5, 3,
What is 3.5?
400
10 + (-2) + 3 =
11
400
Define RANGE and state how to find it.
RANGE is how spread the data or the numbers are.
You find it by subtracting the smallest number from the largest number.
400
The Maximum of this Box and Whisker Plot:
What is 60?
400
Which number of birds is an OUTLIER?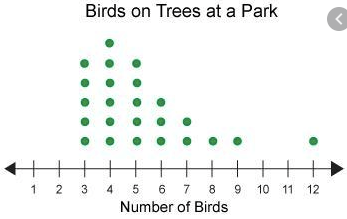
What is 12?
500
The mean of this data set:
3, 8, 7, 4, 9, 5
What is 6?
500
(-8)+(-5)+4 =
-9
500
What is needed to create a Box-and-Whisker Plot? List all parts.
5-Number Summary
Minimum,
Quartile 1 (Q1)
Quartile 2 (Q2) = Median
Quartile 3 (Q)
Maximum
500
The Lower Quartile (Q1) of this Box and Whisker Plot: 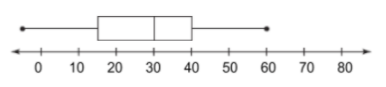
What is 15?
500
The distribution of this frequency graph:

What is symmetrical?