Mean and Median
Variability
Dot Plots
Histograms
Box Plots
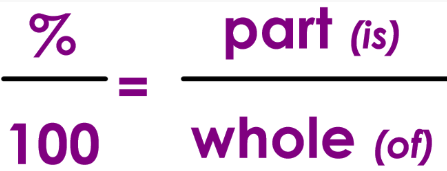
100
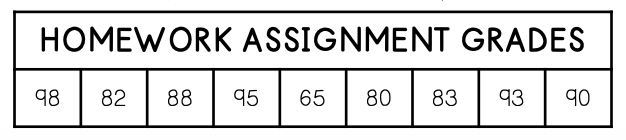
Find the median of the following data set.
19, 33, 41, 24, 18, 29, 32
29
100
Find the range of the data below.
33
100
How would you describe the shape of the data shown in the dot plot?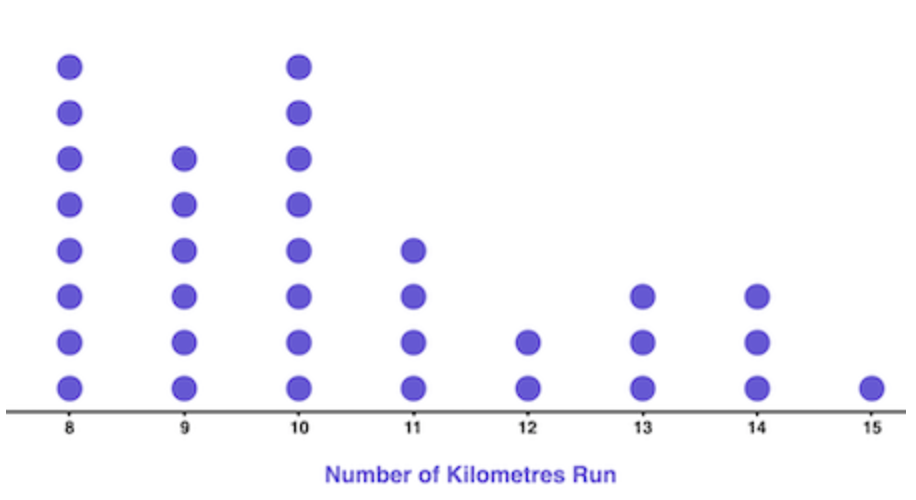
Skewed right
100
In what range of points did most players players score?
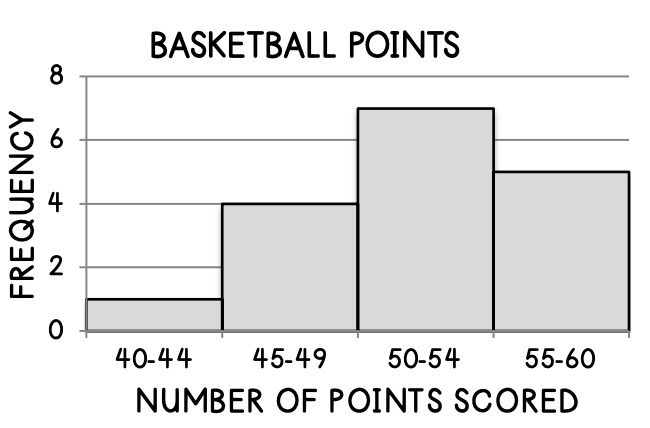
50-54 points
100
What is the median of the box plot below?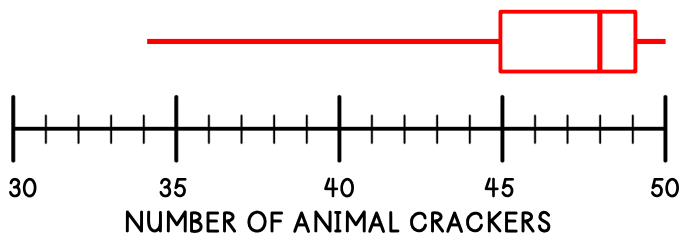
48
Look for the line INSIDE the BOX
200
 The below pictograph shows the data on the number of vehicles parked in a parking lot throughout the week.
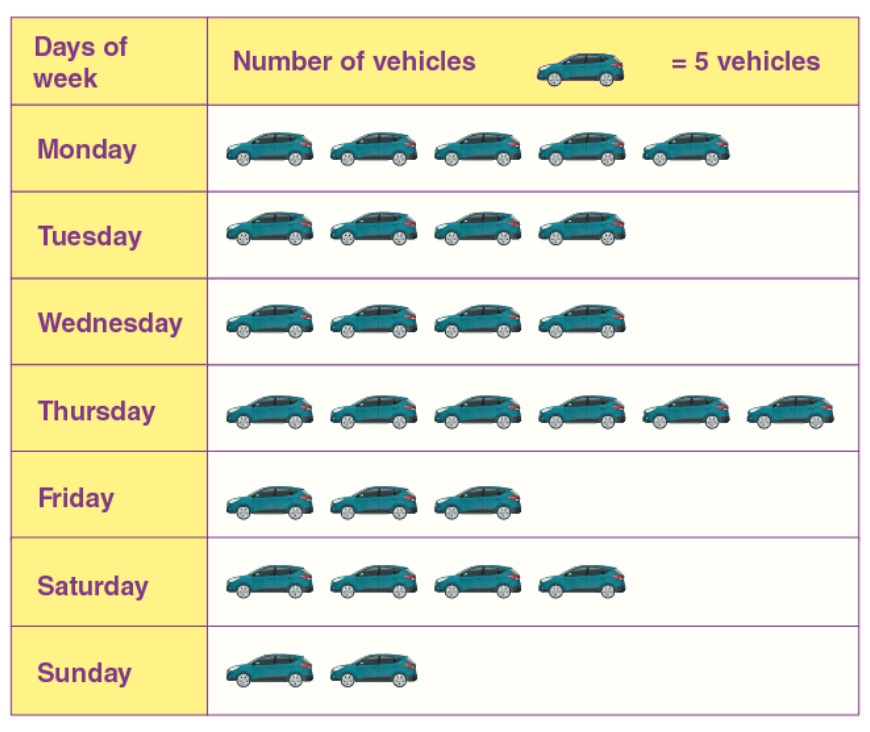
What is the AVERAGE number of vehicles parked in the parking lot for the week?
Hint: each car represents "5" cars
20 cars per day is the average
(There are 7 days so you divide by 7)
(25 + 20 + 20 + 30 + 15 + 20 + 10)/7
200
Find the range of the data below.
7.5, 4.6, 7.1, 7.8, 2.9, 10, 12.7, 8.3, 7.5, 5.4
9.8
200
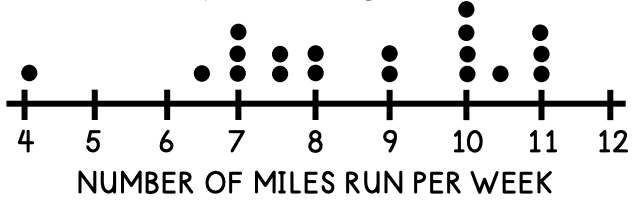
How would you describe the shape of the data in the dot plot shown?
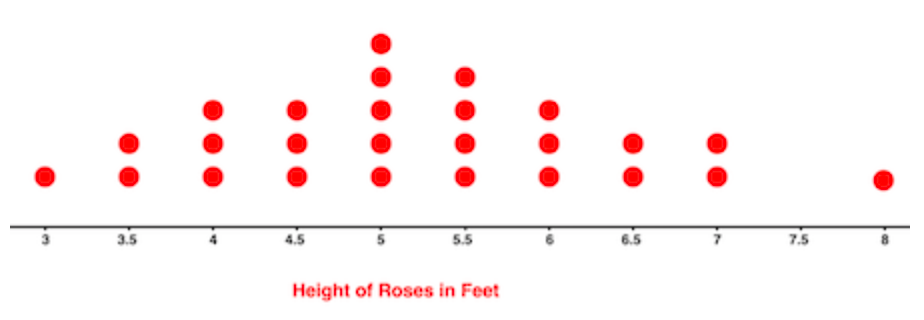
Symmetrical
200
 How many players scored more than 49 points?

More than 49 points:
50-54 = 7
55-60 = 5
7+5 = 12 players scored more than 49 points
200
 Which Data Set could be represented by the box plot shown below??
A) 0, 4, 6, 8, 10, 12, 14
B) 4, 5, 7, 8, 10, 11
C) 4, 6, 6, 8, 9, 11
C
4, 6, 6, 8, 9, 11
Q2 is between 6 and 8 (6+8 = 14/2 = 7)
Q 1 is the middle of the left side (6)
Q3 is the middle of the right side (9)
300
Determine the median of the data below.
87, 95, 101, 79, 92, 108
93.5
300
Find the MIN, Q1, Q2, Q3, Max and
Find the IQR of the data below.
1, 2, 3, 3, 3, 4, 5, 6, 6, 7
Min = 1
Q1 = 3
Q2 = 3.5
Q3 = 6
Max = 7
IQR = 6-3 = 3
300
 Thomas tried to find the median from the following dot plot of number of siblings in his class. However, he made a mistake.
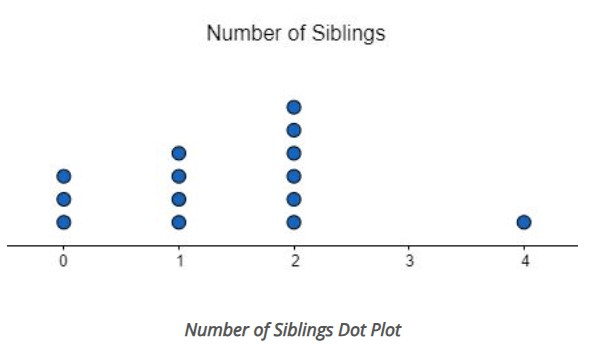
Here is Thomas's work:
"The numbers are 0,0,0,1,1,1,1,2,2,2,2,2,2,4
There are 14 values, so the middle value is the 7th value which is 1. The median is 1 sibling."
What mistake did he make?
When there is an even number of values, the Median will be "between" 2 numbers.
The median here would be between 1 and 2 so the median would be 1+2 = 3/2 = 1.5 siblings
300
The graph shows how many minutes Sam read each day in June. How many more days did Sam read 30-39 minutes than 10-19 minutes?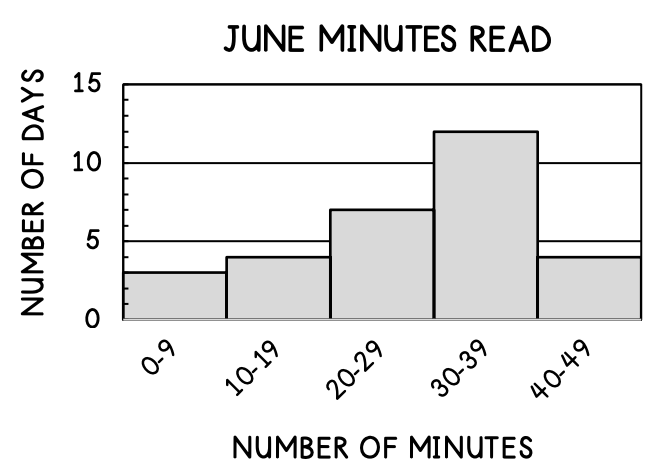
8 days
300
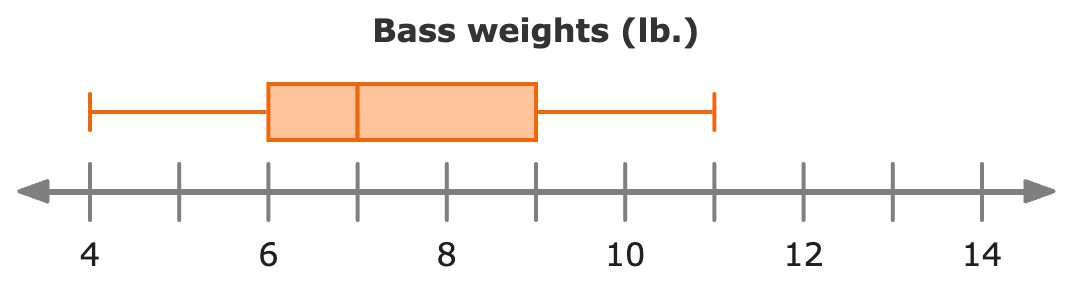
Which data set could be represented by the box plot shown below?
A. 24, 25, 29, 30, 32, 32, 34, 34
B. 24, 25, 27, 31, 32, 32, 34, 35
C. 24, 25, 27, 31, 32, 32, 34, 34
A. 24, 25, 29, 30, 32, 32, 34, 34
The median is between 30 and 32 (31)
The min. is 24 and the max is 34
Q1 is between 24 and 29 (27)
Q2 is between 32 and 34 (33)
400
Determine what the mean would be if 5 was added to the data below.
2.5, 6, 3.1, 4.5, 1.1, 3
Would it increase the mean?
Would it increase the median?
3.6
It would increase the mean because 5 would almost be the highest number.
It wouldn't change the median much because the middle would be between the 3rd and 4th to begin with. After adding 5, the median would be the 4th number.
400
Find the interquartile range of the following set of data.
10, 32, 14, 17, 23, 24, 23
10
400
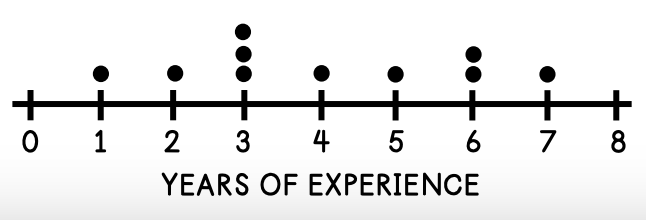
Based on the shape of the data below, what is the best measure of center for the data?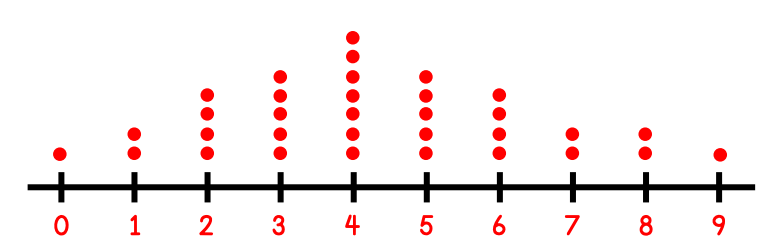
Mean is the best measure of center since the data is symmetrical.
400
According to the histogram below, what percent of the patrons surveyed were between 10-29 years old?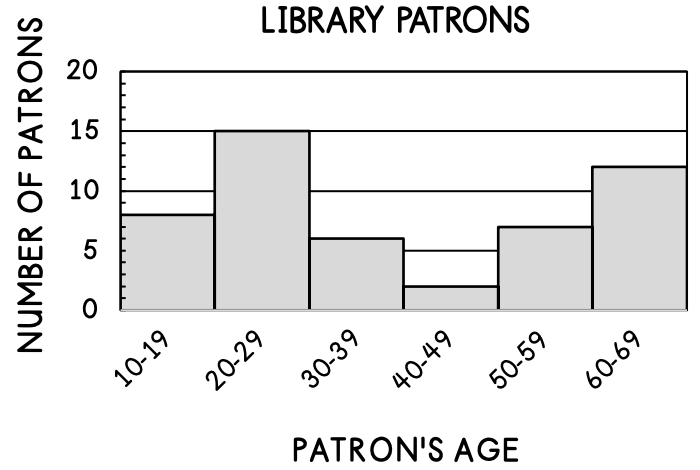
46%
23/50 x 100 = 46%
400
Which team has greater variability in shoe sizes?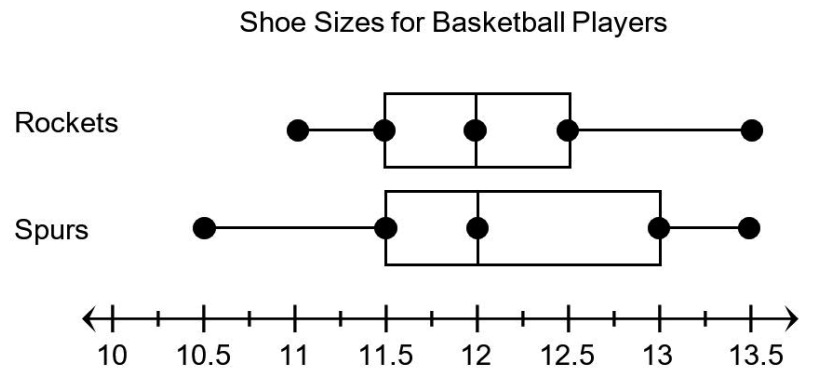
Spurs
Variability has to do with the range.
The rockets have a range of (13.5 - 11 = 2.5)
The spurs have a range of (13.5 - 10.5 = 3)
500
 The mean of the following set of data is 12.
10, 15, 6, 14, 15, 8, ?
What value should replace the question mark to make the statement true?
16
TO find the missing value:
Mean (# of known and unknown values) - known values
12 (7) - 10 - 15 - 6 - 14 - 15 - 8 = 16
500
Find the interquartile range.
3
500
What is the "typical" number of pieces of candy?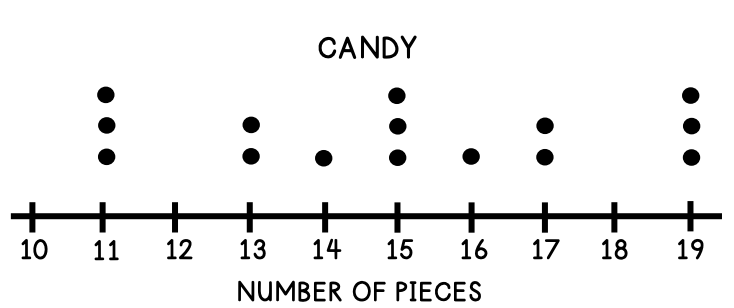
15 pieces of candy
Typical can be the mean if there are no outliers.
If there are outliers, you would find the median instead.
Both the mean and the median are 15 in this question.
500
According to the graph, which two age ranges make up 40% of the data?

10-19 and 60-69
40% of 50 is 20
10-19 is 8 and 60-69 is 12
500
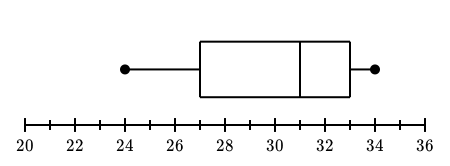
 What is the 5 number summary for the box plot below? Also, what is the IQR?
min= 24
Q1= 27
med= 31
Q3= 33
max= 34
The IQR = Q3 - Q1 so 33 - 27 = 6